

Question: don't copy from the previous answers!!! I need the table and all the calculations in exel, please provide formulas as well -> use excel for
don't copy from the previous answers!!! I need the table and all the calculations in exel, please provide formulas as well -> use excel for calculation, as well as creating the table - horizontal (value)axis major gridlines
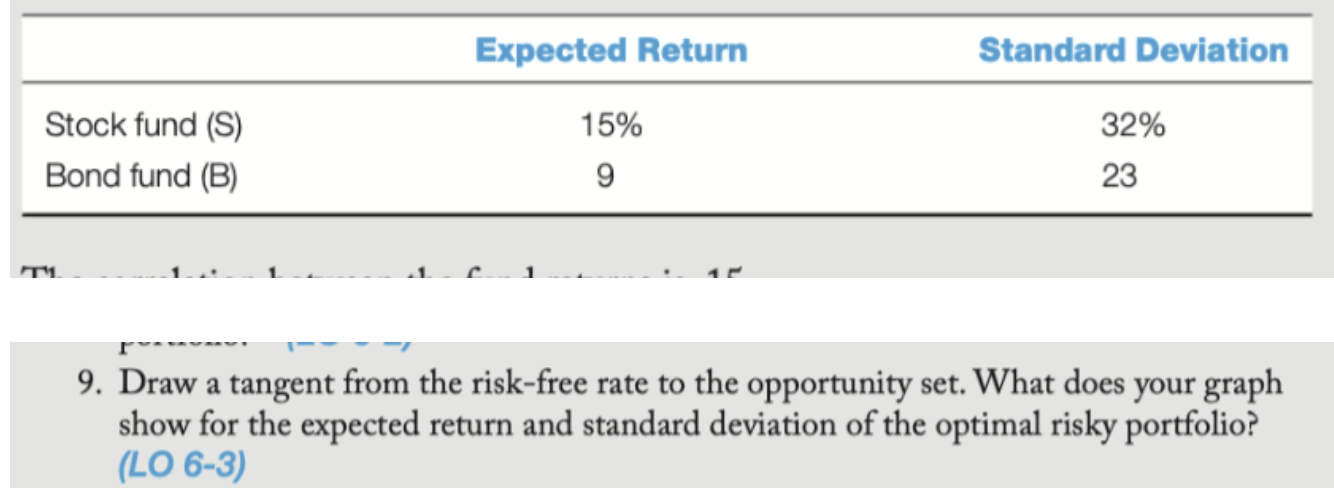
Expected Return Standard Deviation Stock fund (S) Bond fund (B) 15% 9 32% 23 9. Draw a tangent from the risk-free rate to the opportunity set. What does your graph show for the expected return and standard deviation of the optimal risky portfolio? (LO 6-3) Expected Return Standard Deviation Stock fund (S) Bond fund (B) 15% 9 32% 23 9. Draw a tangent from the risk-free rate to the opportunity set. What does your graph show for the expected return and standard deviation of the optimal risky portfolio? (LO 6-3)
Step by Step Solution
There are 3 Steps involved in it

Get step-by-step solutions from verified subject matter experts