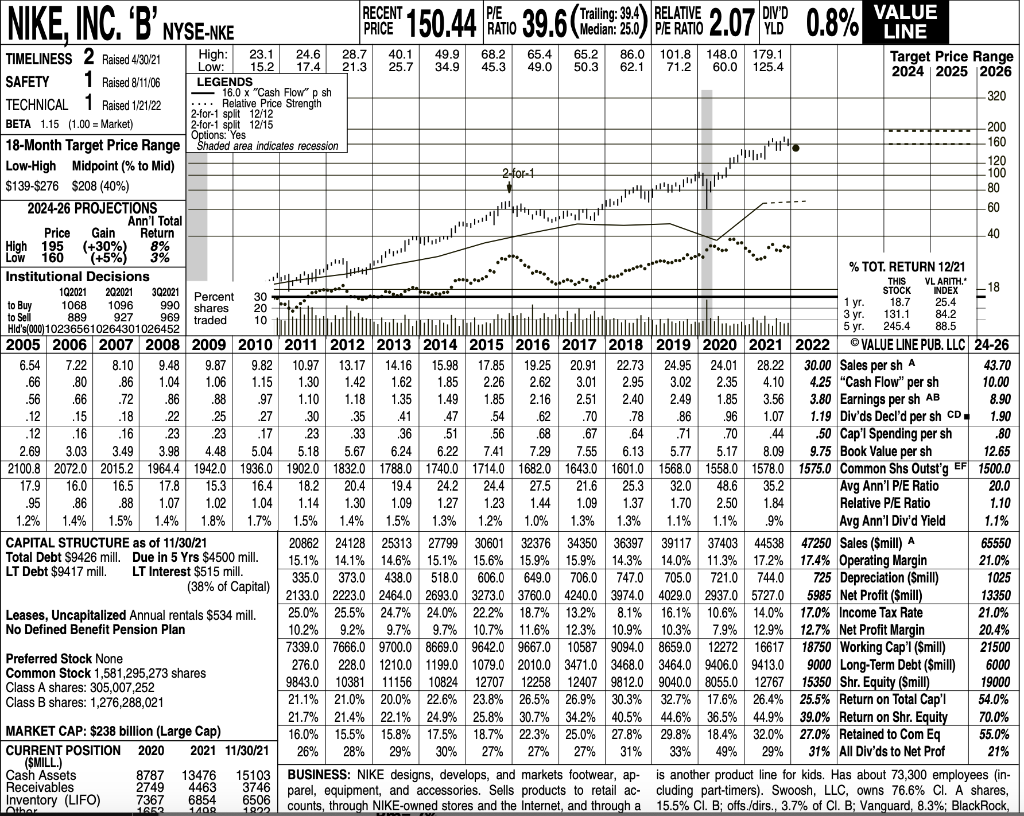
Download a copy of Nikes financial report posted as a separate PDF file on Blackboard. As we discussed in class using P&G case, all numbers in boldface are estimates. In this case, you will see that all figures in 2022 are estimates and all figures from 2005 2021 are actual data. We would like to estimate the stock price for 2022. Assuming that D2022 is not paid yet and the current time is Jan. 21, 2022.
- Using the Dividend Discount Model
Step 1: Find the discount rate using CAPM model with Treasury bill rate of 4% and a historical market risk premium of 7%.
Step 2: Find two growth rates:
- sustainable growth rate, g1
- the geometric average dividend growth rate, g2, using dividends from 2017 2021.
Step 3.
- Estimate P2022 using g1 (where g1 is the sustainable growth rate)

NIKE, INC. 'B' NYSE:NKE PERCENT 150.44 PATIO 39.6 (Medline : 23:2) PELAAYE 2.07 0.8% ---- to Buy PE TrailingRELATIVE DIV'D VALUE YLD LINE TIMELINESS 2 Raised 4/30/21 High: 23.1 24.6 28.7 40.1 49.9 68.2 65.4 65.2 86.0 101.8 148.0 179.1 Target Price Range Low: 15.2 17.4 21.3 25.7 34.9 45.3 49.0 50.3 62.1 71.2 60.0 125.4 SAFETY 1 Raised 8/11/06 LEGENDS 2024 2025 2026 16.0 x "Cash Flow" p sh TECHNICAL 1 Raised 1/21/22 .... Relative Price Strength 320 2-for-1 Split 12/12 BETA 1.15 (1.00 = Market) 2-for-1 Split 12/15 Options: Yes 200 18-Month Target Price Range Shaded area indicates recession 160 Low-High Midpoint (% to Mid) 2-for-1 120 100 $139-$276 $208 (40%) -80 2024-26 PROJECTIONS 60 Ann'l Total Price Gain Return High 40 195 (+30%) 8% Low 160 (+5%) 3% Institutional Decisions % TOT. RETURN 12/21 THIS VL ARITH. 192021 202021 3Q2021 Percent 30 STOCK INDEX E18 1068 1096 990 shares 20. 1 yr. 18.7 25.4 to Seli 889 927 969 traded 10 3 yr. 131.1 84.2 Hid's(000102365610264301026452 5 yr. 245.4 88.5 2005 2006 2007 2008 2009 2010 2011 2012 2013 2014 2015 2016 2017 2018 2019 2020 2021 2022 VALUE LINE PUB. LLC 24-26 6.54 7.22 8.10 9.48 9.87 9.82 10.97 13.17 14.16 15.98 17.85 19.25 20.91 22.73 24.95 24.01 28.22 30.00 Sales per sh A 43.70 .66 .80 .86 1.04 1.06 1.15 1.30 1.42 1.62 1.85 2.26 2.62 3.01 2.95 3.02 2.35 4.10 4.25 "Cash Flow" per sh 10.00 .56 .66 .72 .86 .88 .97 1.10 1.18 1.35 1.49 1.85 2.16 2.51 2.40 2.49 1.85 3.56 3.80 Earnings per sh AB 8.90 .12 .15 .18 .22 25 27 .30 .35 41 .47 54 .62 .70 .78 .86 .96 1.07 1.19 Div'ds Decl'd per sh CD 1.90 .12 .16 .16 .23 .23 .17 23 .33 .36 .51 .56 .68 .67 .64 .71 .70 44 .50 Cap'l Spending per sh .80 2.69 3.03 3.49 3.98 4.48 5.04 5.18 5.67 6.24 6.22 7.41 7.29 7.55 6.13 5.77 5.17 8.09 9.75 Book Value per sh 12.65 2100.8 2072.0 2015.2 1964.4 1942.0 1936.0 1902.0 1832.0 1788.0 1740.0 1714.0 1682.0 1643.0 1601.0 1568.0 1558.0 1578.0 1575.0 Common Shs Outstig EF 1500.0 17.9 16.0 16.5 17.8 15.3 16.4 18.2 20.4 19.4 24.2 24.4 27.5 21.6 25.3 32.0 48.6 35.2 Avg Ann' P/E Ratio 20.0 .95 .86 .88 1.07 1.02 1.04 1.14 1.30 1.09 1.27 1.23 1.44 1.09 1.37 1.70 2.50 1.84 Relative P/E Ratio 1.10 1.2% 1.4% 1.5% 1.4% 1.8% 1.7% 1.5% 1.4% 1.5% 1.3% 1.2% 1.0% 1.3% 1.3% 1.1% 1.1% .9% Avg Ann'l Div'd Yield 1.1% CAPITAL STRUCTURE as of 11/30/21 20862 24128 25313 27799 30601 32376 34350 36397 39117 37403 44538 47250 Sales (Smill) A 65550 Total Debt $9426 mill. Due in 5 Yrs $4500 mill. 15.1% 14.1% 14.6% 15.1% 15.6% 15.9% 15.9% 14.3% 14.0% 11.3% 17.2% LT Debt $9417 mill. 17.4% Operating Margin 21.0% LT Interest $515 mill. 335.0 373.0 438.0 518.0 606.0 649.0 706.0 747.0 705.0 721.0 744.0 (38% of Capital) 725 Depreciation (Smill) 1025 2133.0 2223.0 2464.0 2693.0 3273.0 3760.0 4240.0 3974.0 4029.0 2937.0 5727.0 5985 Net Profit ($ml) 13350 Leases, Uncapitalized Annual rentals $534 mill. 25.0% 25.5% 24.7% 24.0% 22.2% 18.7% 13.2% 8.1% 14.0% 17.0% Income Tax Rate 21.0% No Defined Benefit Pension Plan 10.2% 9.2% 9.7% 9.7% 10.7% 11.6% 12.3% 10.9% 10.3% 7.9% 12.9% 12.7% Net Profit Margin 20.4% 7339.0 7666.0 9700.0 8669.0 9642.0 9667.0 10587 9094.0 8659.0 12272 Preferred Stock None 16617 18750 Working Cap'l (Smill) 21500 276.0 228.0 1210.0 1199.0 1079.0 2010.0 3471.0 3468.0 3464.0 9406.0 9413.0 Common Stock 1,581,295,273 shares 9000 Long-Term Debt (Smill) 6000 Class A shares: 305,007,252 9843.0 10381 11156 10824 12707 12258 12407 9812.0 9040.0 8055.0 12767 15350 Shr. Equity (Smill) 19000 Class B shares: 1,276,288,021 21.1% 21.0% 20.0% 22.6% 23.8% 26.5% 26.9% 30.3% 32.7% 17.6% 26.4% 25.5% Return on Total Cap'l 54.0% 21.7% 21.4% 22.1% 24.9% 25.8% 30.7% 34.2% 40.5% 44.6% 36.5% 44.9% 39.0% Return on Shr. Equity 70.0% MARKET CAP: $238 billion (Large Cap) 16.0% 15.5% 15.8% 17.5% 18.7% 22.3% 25.0% 27.8% 29.8% 18.4% 32.0% 27.0% Retained to Com Eq 55.0% CURRENT POSITION 2020 2021 11/30/21 26% 28% 29% 30% 27% 27% 27% 31% 33% 49% 29% 31% All Div'ds to Net Prof 21% (SMILL.) Cash Assets 8787 13476 15103 BUSINESS: NIKE designs, develops, and markets footwear, ap- is another product line for kids. Has about 73,300 employees (in- Receivables 2749 4463 3746 Inventory (LIFO) parel, equipment, and accessories. Sells products to retail ac- cluding part-timers). Swoosh, LLC, owns 76.6% Cl. A shares, 7367 6854 6506 Athar 165 1400 1995 counts, through NIKE-owned stores and the Internet, and through a 15.5% CI. B; offs./dirs., 3.7% of Cl. B; Vanguard, 8.3%; Black Rock, 16.1% 10.6% NIKE, INC. 'B' NYSE:NKE PERCENT 150.44 PATIO 39.6 (Medline : 23:2) PELAAYE 2.07 0.8% ---- to Buy PE TrailingRELATIVE DIV'D VALUE YLD LINE TIMELINESS 2 Raised 4/30/21 High: 23.1 24.6 28.7 40.1 49.9 68.2 65.4 65.2 86.0 101.8 148.0 179.1 Target Price Range Low: 15.2 17.4 21.3 25.7 34.9 45.3 49.0 50.3 62.1 71.2 60.0 125.4 SAFETY 1 Raised 8/11/06 LEGENDS 2024 2025 2026 16.0 x "Cash Flow" p sh TECHNICAL 1 Raised 1/21/22 .... Relative Price Strength 320 2-for-1 Split 12/12 BETA 1.15 (1.00 = Market) 2-for-1 Split 12/15 Options: Yes 200 18-Month Target Price Range Shaded area indicates recession 160 Low-High Midpoint (% to Mid) 2-for-1 120 100 $139-$276 $208 (40%) -80 2024-26 PROJECTIONS 60 Ann'l Total Price Gain Return High 40 195 (+30%) 8% Low 160 (+5%) 3% Institutional Decisions % TOT. RETURN 12/21 THIS VL ARITH. 192021 202021 3Q2021 Percent 30 STOCK INDEX E18 1068 1096 990 shares 20. 1 yr. 18.7 25.4 to Seli 889 927 969 traded 10 3 yr. 131.1 84.2 Hid's(000102365610264301026452 5 yr. 245.4 88.5 2005 2006 2007 2008 2009 2010 2011 2012 2013 2014 2015 2016 2017 2018 2019 2020 2021 2022 VALUE LINE PUB. LLC 24-26 6.54 7.22 8.10 9.48 9.87 9.82 10.97 13.17 14.16 15.98 17.85 19.25 20.91 22.73 24.95 24.01 28.22 30.00 Sales per sh A 43.70 .66 .80 .86 1.04 1.06 1.15 1.30 1.42 1.62 1.85 2.26 2.62 3.01 2.95 3.02 2.35 4.10 4.25 "Cash Flow" per sh 10.00 .56 .66 .72 .86 .88 .97 1.10 1.18 1.35 1.49 1.85 2.16 2.51 2.40 2.49 1.85 3.56 3.80 Earnings per sh AB 8.90 .12 .15 .18 .22 25 27 .30 .35 41 .47 54 .62 .70 .78 .86 .96 1.07 1.19 Div'ds Decl'd per sh CD 1.90 .12 .16 .16 .23 .23 .17 23 .33 .36 .51 .56 .68 .67 .64 .71 .70 44 .50 Cap'l Spending per sh .80 2.69 3.03 3.49 3.98 4.48 5.04 5.18 5.67 6.24 6.22 7.41 7.29 7.55 6.13 5.77 5.17 8.09 9.75 Book Value per sh 12.65 2100.8 2072.0 2015.2 1964.4 1942.0 1936.0 1902.0 1832.0 1788.0 1740.0 1714.0 1682.0 1643.0 1601.0 1568.0 1558.0 1578.0 1575.0 Common Shs Outstig EF 1500.0 17.9 16.0 16.5 17.8 15.3 16.4 18.2 20.4 19.4 24.2 24.4 27.5 21.6 25.3 32.0 48.6 35.2 Avg Ann' P/E Ratio 20.0 .95 .86 .88 1.07 1.02 1.04 1.14 1.30 1.09 1.27 1.23 1.44 1.09 1.37 1.70 2.50 1.84 Relative P/E Ratio 1.10 1.2% 1.4% 1.5% 1.4% 1.8% 1.7% 1.5% 1.4% 1.5% 1.3% 1.2% 1.0% 1.3% 1.3% 1.1% 1.1% .9% Avg Ann'l Div'd Yield 1.1% CAPITAL STRUCTURE as of 11/30/21 20862 24128 25313 27799 30601 32376 34350 36397 39117 37403 44538 47250 Sales (Smill) A 65550 Total Debt $9426 mill. Due in 5 Yrs $4500 mill. 15.1% 14.1% 14.6% 15.1% 15.6% 15.9% 15.9% 14.3% 14.0% 11.3% 17.2% LT Debt $9417 mill. 17.4% Operating Margin 21.0% LT Interest $515 mill. 335.0 373.0 438.0 518.0 606.0 649.0 706.0 747.0 705.0 721.0 744.0 (38% of Capital) 725 Depreciation (Smill) 1025 2133.0 2223.0 2464.0 2693.0 3273.0 3760.0 4240.0 3974.0 4029.0 2937.0 5727.0 5985 Net Profit ($ml) 13350 Leases, Uncapitalized Annual rentals $534 mill. 25.0% 25.5% 24.7% 24.0% 22.2% 18.7% 13.2% 8.1% 14.0% 17.0% Income Tax Rate 21.0% No Defined Benefit Pension Plan 10.2% 9.2% 9.7% 9.7% 10.7% 11.6% 12.3% 10.9% 10.3% 7.9% 12.9% 12.7% Net Profit Margin 20.4% 7339.0 7666.0 9700.0 8669.0 9642.0 9667.0 10587 9094.0 8659.0 12272 Preferred Stock None 16617 18750 Working Cap'l (Smill) 21500 276.0 228.0 1210.0 1199.0 1079.0 2010.0 3471.0 3468.0 3464.0 9406.0 9413.0 Common Stock 1,581,295,273 shares 9000 Long-Term Debt (Smill) 6000 Class A shares: 305,007,252 9843.0 10381 11156 10824 12707 12258 12407 9812.0 9040.0 8055.0 12767 15350 Shr. Equity (Smill) 19000 Class B shares: 1,276,288,021 21.1% 21.0% 20.0% 22.6% 23.8% 26.5% 26.9% 30.3% 32.7% 17.6% 26.4% 25.5% Return on Total Cap'l 54.0% 21.7% 21.4% 22.1% 24.9% 25.8% 30.7% 34.2% 40.5% 44.6% 36.5% 44.9% 39.0% Return on Shr. Equity 70.0% MARKET CAP: $238 billion (Large Cap) 16.0% 15.5% 15.8% 17.5% 18.7% 22.3% 25.0% 27.8% 29.8% 18.4% 32.0% 27.0% Retained to Com Eq 55.0% CURRENT POSITION 2020 2021 11/30/21 26% 28% 29% 30% 27% 27% 27% 31% 33% 49% 29% 31% All Div'ds to Net Prof 21% (SMILL.) Cash Assets 8787 13476 15103 BUSINESS: NIKE designs, develops, and markets footwear, ap- is another product line for kids. Has about 73,300 employees (in- Receivables 2749 4463 3746 Inventory (LIFO) parel, equipment, and accessories. Sells products to retail ac- cluding part-timers). Swoosh, LLC, owns 76.6% Cl. A shares, 7367 6854 6506 Athar 165 1400 1995 counts, through NIKE-owned stores and the Internet, and through a 15.5% CI. B; offs./dirs., 3.7% of Cl. B; Vanguard, 8.3%; Black Rock, 16.1% 10.6%


