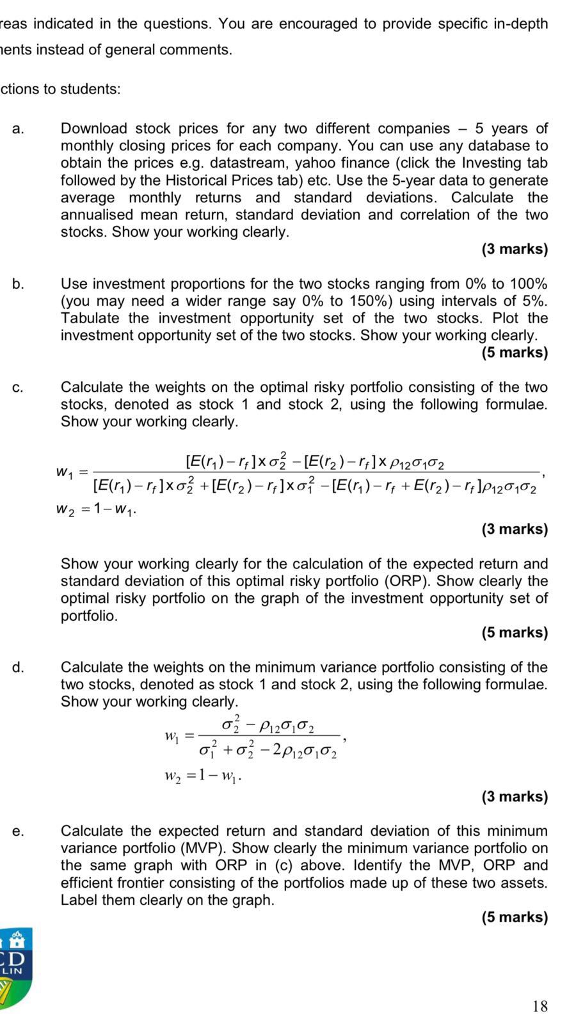
Download stock prices for any two different companies - 5 years of monthly closing prices for each company. You can use any database to obtain the prices e.g. datastream, yahoo finance (click the Investing tab followed by the Historical Prices tab) etc. Use the 5-year data to generate average monthly returns and standard deviations. Calculate the annualised mean return, standard deviation and correlation of the two stocks. Show your working clearly. b. Use investment proportions for the two stocks ranging from 0% to 100% (you may need a wider range say 0% to 150%) using intervals of 5%. Tabulate the investment opportunity set of the two stocks. Plot the investment opportunity set of the two stocks. Show your working clearly. c. Calculate the weights on the optimal risky portfolio consisting of the two stocks, denoted as stock 1 and stock 2, using the following formulae. Show your working clearly. w_1 = [E(r_1) - r_f] Times sigma^2_2 - [E(r_2) - r_f] Times rho_12 sigma_1 sigma_2/[E(r_1) - r_f] Times sigma^2_2 + [E(r_2) - r_f] Times sigma^2_1 - [E(r_1) - r_f + E(r_2) - r_f] rho_12 sigma_1 sigma_2, w_2 = 1 - w_1. Show your working clearly for the calculation of the expected return and standard deviation of this optimal risky portfolio (ORP). Show clearly the optimal risky portfolio on the graph of the investment opportunity set of portfolio. d. Calculate the weights on the minimum variance portfolio consisting of the two stocks, denoted as stock 1 and stock 2, using the following formulae. Show your working clearly. w_1 = sigma^2_2 - rho_12 sigma_1 sigma_2/sihma^2_1 + sigma^2_2 - 2 rho_12 sigma_1 sigma_2, w_2 = 1 - w_1. e. Calculate the expected return and standard deviation of this minimum variance portfolio (MVP). Show clearly the minimum variance portfolio on the same graph with ORP in (c) above. Identify the MVP, ORP and efficient frontier consisting of the portfolios made up of these two assets. Label them clearly on the graph. Download stock prices for any two different companies - 5 years of monthly closing prices for each company. You can use any database to obtain the prices e.g. datastream, yahoo finance (click the Investing tab followed by the Historical Prices tab) etc. Use the 5-year data to generate average monthly returns and standard deviations. Calculate the annualised mean return, standard deviation and correlation of the two stocks. Show your working clearly. b. Use investment proportions for the two stocks ranging from 0% to 100% (you may need a wider range say 0% to 150%) using intervals of 5%. Tabulate the investment opportunity set of the two stocks. Plot the investment opportunity set of the two stocks. Show your working clearly. c. Calculate the weights on the optimal risky portfolio consisting of the two stocks, denoted as stock 1 and stock 2, using the following formulae. Show your working clearly. w_1 = [E(r_1) - r_f] Times sigma^2_2 - [E(r_2) - r_f] Times rho_12 sigma_1 sigma_2/[E(r_1) - r_f] Times sigma^2_2 + [E(r_2) - r_f] Times sigma^2_1 - [E(r_1) - r_f + E(r_2) - r_f] rho_12 sigma_1 sigma_2, w_2 = 1 - w_1. Show your working clearly for the calculation of the expected return and standard deviation of this optimal risky portfolio (ORP). Show clearly the optimal risky portfolio on the graph of the investment opportunity set of portfolio. d. Calculate the weights on the minimum variance portfolio consisting of the two stocks, denoted as stock 1 and stock 2, using the following formulae. Show your working clearly. w_1 = sigma^2_2 - rho_12 sigma_1 sigma_2/sihma^2_1 + sigma^2_2 - 2 rho_12 sigma_1 sigma_2, w_2 = 1 - w_1. e. Calculate the expected return and standard deviation of this minimum variance portfolio (MVP). Show clearly the minimum variance portfolio on the same graph with ORP in (c) above. Identify the MVP, ORP and efficient frontier consisting of the portfolios made up of these two assets. Label them clearly on the graph