

Answered step by step
Verified Expert Solution
Question
1 Approved Answer
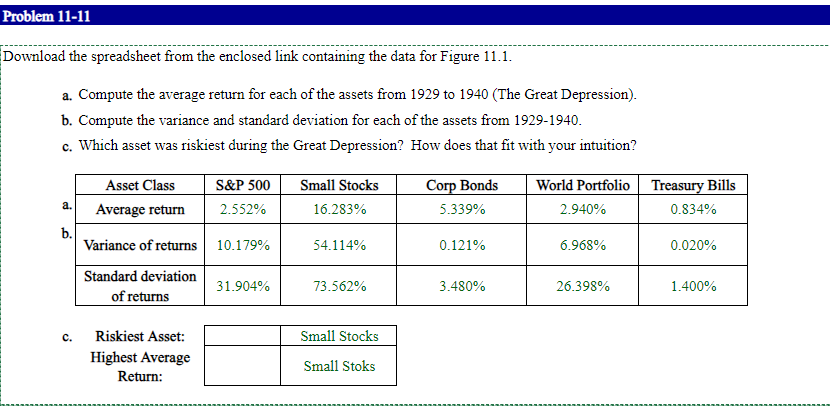
Download the spreadsheet from the enclosed link containing the data for Figure 1 1 . 1 . a . Compute the average return for each
Download the spreadsheet from the enclosed link containing the data for Figure
a Compute the average return for each of the assets from to The Great Depression
b Compute the variance and standard deviation for each of the assets from
c Which asset was riskiest during the Great Depression? How does that fit with your intuition?
a
c
Step by Step Solution
There are 3 Steps involved in it
Step: 1

Get Instant Access to Expert-Tailored Solutions
See step-by-step solutions with expert insights and AI powered tools for academic success
Step: 2

Step: 3
Ace Your Homework with AI
Get the answers you need in no time with our AI-driven, step-by-step assistance
Get Started
An Introduction To Wavelet Theory In Finance
Authors: Francis In, Sangbae Kim
1st Edition
9814397830, 978-9814397834