

Answered step by step
Verified Expert Solution
Question
1 Approved Answer
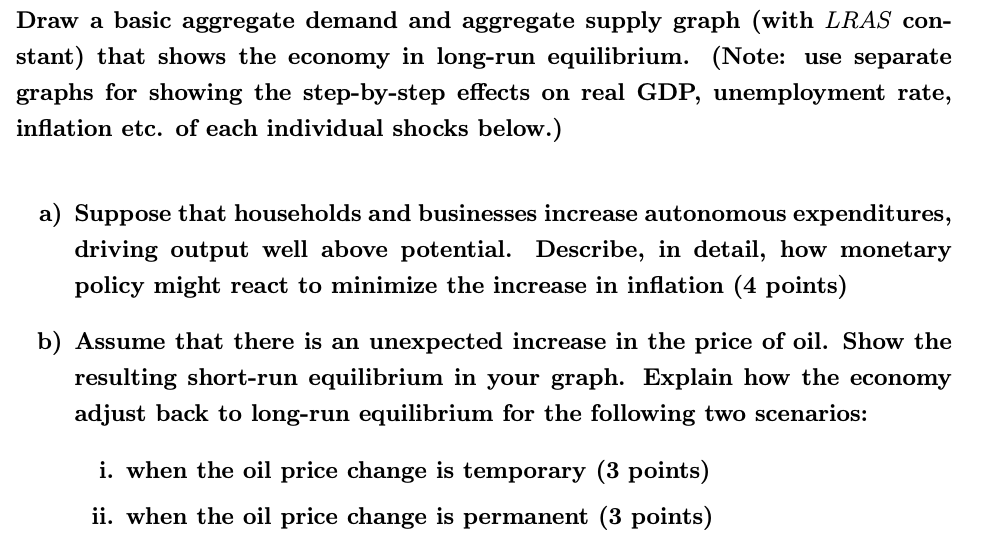
Draw a basic aggregate demand and aggregate supply graph (with LRAS con- stant) that shows the economy in long-run equilibrium. (Note: use separate graphs for

Step by Step Solution
There are 3 Steps involved in it
Step: 1

Get Instant Access to Expert-Tailored Solutions
See step-by-step solutions with expert insights and AI powered tools for academic success
Step: 2

Step: 3
Ace Your Homework with AI
Get the answers you need in no time with our AI-driven, step-by-step assistance
Get Started
Organizational Behavior And Management
Authors: John Ivancevich, Michael Matteson
6th Edition
0072436387, 978-0072436389