Question
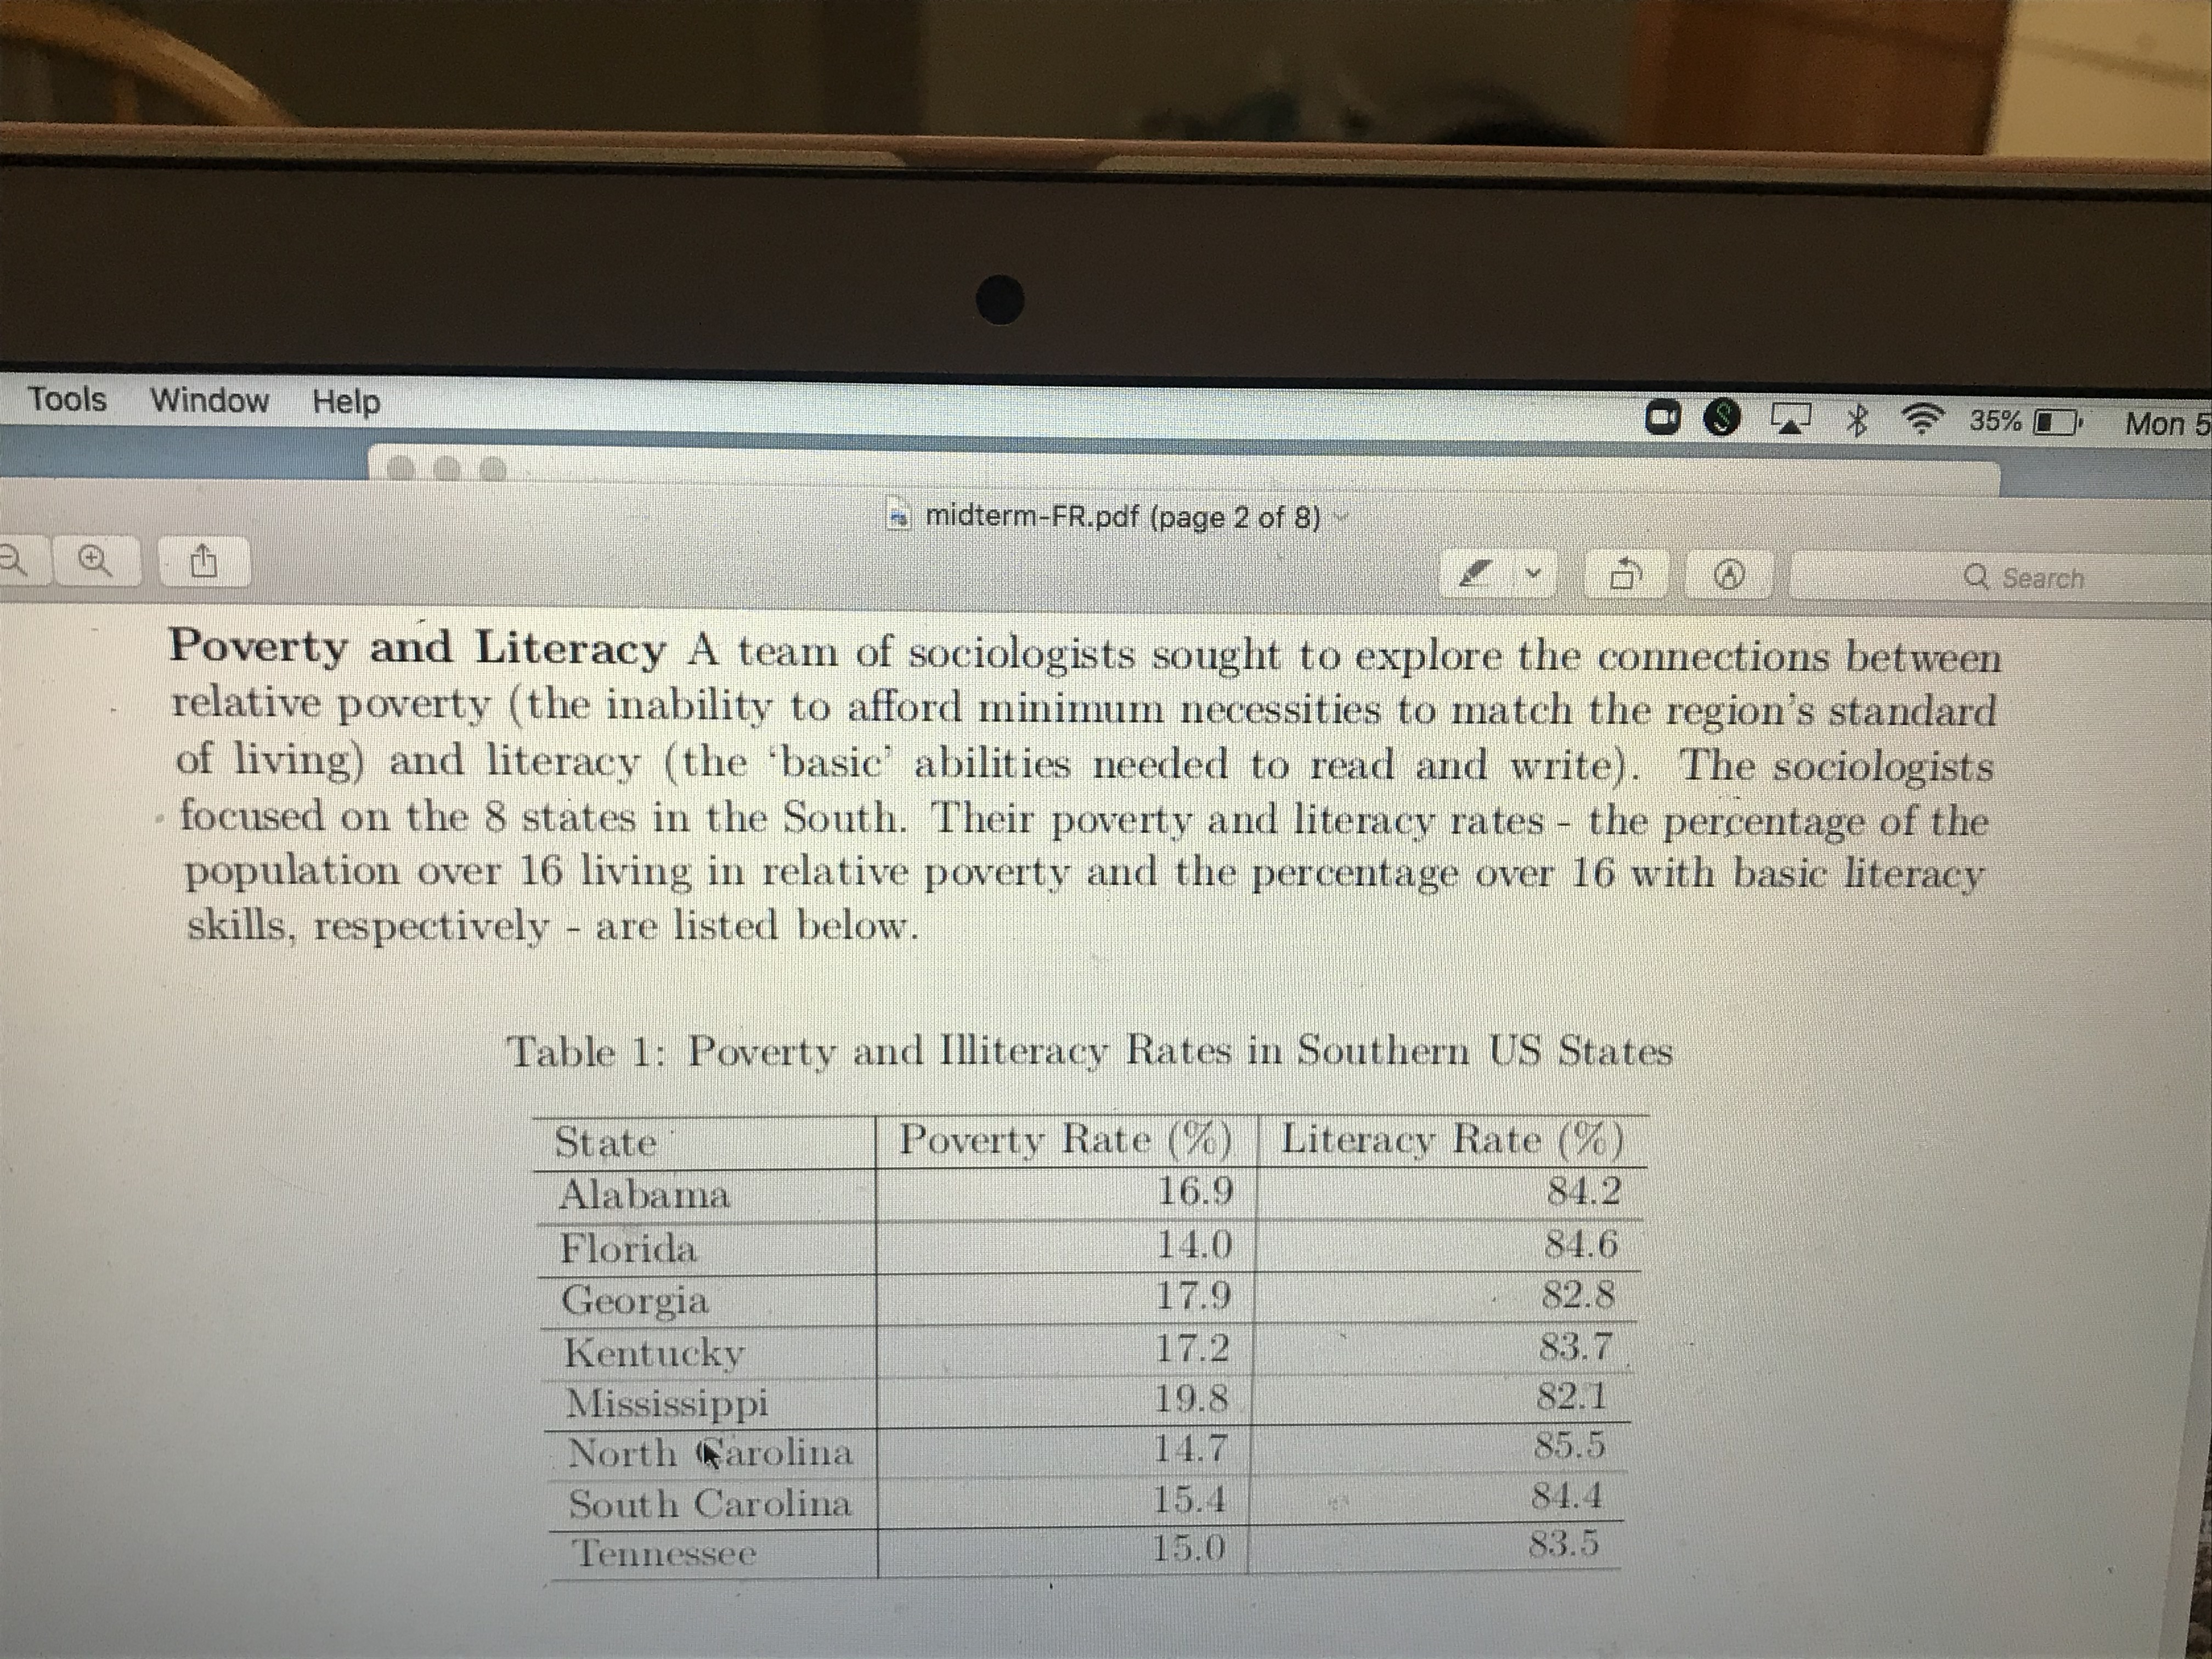
Draw a scatterplot of these data. Let poverty rate be your x-axis. Be sure to label your axes appropriately. Part B Describe the scatterplot to
Draw a scatterplot of these data. Let "poverty rate be your x-axis. Be sure to label your axes appropriately.
Part B
Describe the scatterplot to support your description, calculate and interpret Pearson's r for this two variable association. Round r to 4 decimal places
Part C
Before conducting a least squares regression analysis, confirm that the conditions for regression are met
Part e
Interpret the regression equation. Using Rsquared, evaluate if this linear model is appropriate for describing the relationship between poverty rate and literacy rate.
Part F
does this model suggest that higher poverty rates cause higher rate of literacy? Why or why not. Additionally, do you think it's appropriate or wise to apply this regression equation to other states in the US? why or why not?

Step by Step Solution
There are 3 Steps involved in it
Step: 1

Get Instant Access to Expert-Tailored Solutions
See step-by-step solutions with expert insights and AI powered tools for academic success
Step: 2

Step: 3

Ace Your Homework with AI
Get the answers you need in no time with our AI-driven, step-by-step assistance
Get Started


