Question
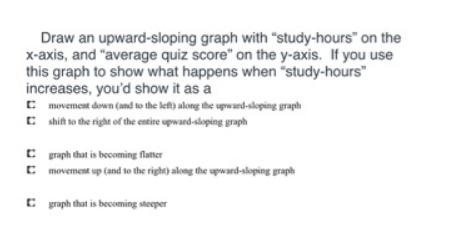
Draw an upward-sloping graph with study-hours on the x-axis, and average quiz score on the y-axis. If you use this graph to show what

Draw an upward-sloping graph with "study-hours" on the x-axis, and "average quiz score" on the y-axis. If you use this graph to show what happens when "study-hours" increases, you'd show it as a C movement down (and to the left) along the upward-sloping graph C shift so the right of the entire upward-slaping graph C praph that is becoming flater C movement up (and to the right) akong the upwaed-skoping graph C praph that is becoming steeper
Step by Step Solution
3.50 Rating (160 Votes )
There are 3 Steps involved in it
Step: 1
solution Yaxis movement ...
Get Instant Access to Expert-Tailored Solutions
See step-by-step solutions with expert insights and AI powered tools for academic success
Step: 2

Step: 3

Ace Your Homework with AI
Get the answers you need in no time with our AI-driven, step-by-step assistance
Get StartedRecommended Textbook for
Microeconomics
Authors: Jeffrey M. Perloff
8th edition
134519531, 978-0134519531
Students also viewed these Accounting questions
Question
Answered: 1 week ago
Question
Answered: 1 week ago
Question
Answered: 1 week ago
Question
Answered: 1 week ago
Question
Answered: 1 week ago
Question
Answered: 1 week ago
Question
Answered: 1 week ago
Question
Answered: 1 week ago
Question
Answered: 1 week ago
Question
Answered: 1 week ago
Question
Answered: 1 week ago
Question
Answered: 1 week ago
Question
Answered: 1 week ago
Question
Answered: 1 week ago
Question
Answered: 1 week ago
Question
Answered: 1 week ago
Question
Answered: 1 week ago
Question
Answered: 1 week ago
Question
Answered: 1 week ago
Question
Answered: 1 week ago
Question
Answered: 1 week ago
Question
Answered: 1 week ago
View Answer in SolutionInn App


