Answered step by step
Verified Expert Solution
Question
1 Approved Answer
Draw (create) a random sample of 50 from the full database then answer the following questions. You will ultimately use the sample of 50

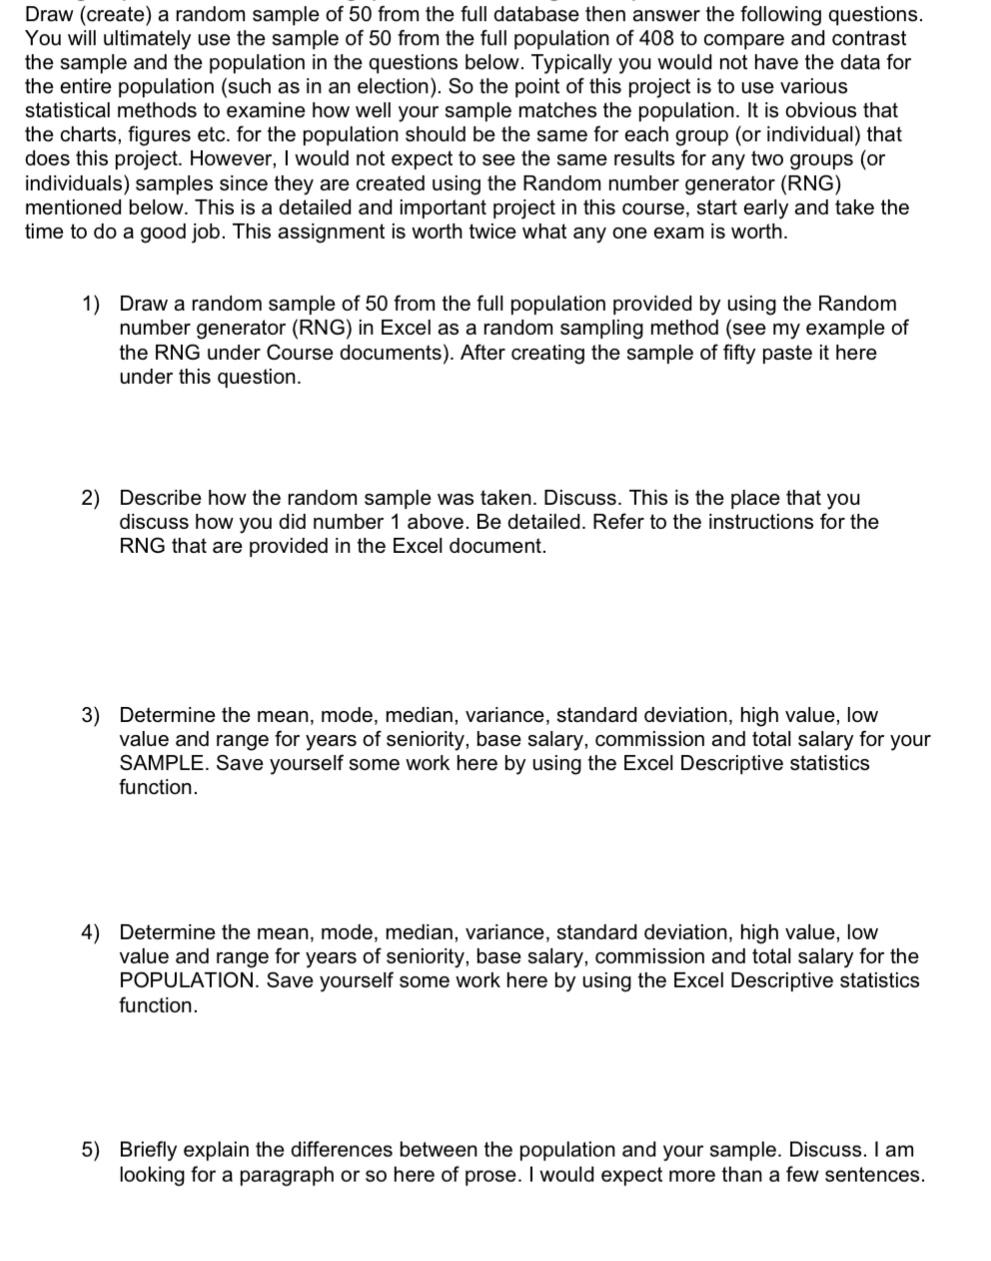
Draw (create) a random sample of 50 from the full database then answer the following questions. You will ultimately use the sample of 50 from the full population of 408 to compare and contrast the sample and the population in the questions below. Typically you would not have the data for the entire population (such as in an election). So the point of this project is to use various statistical methods to examine how well your sample matches the population. It is obvious that the charts, figures etc. for the population should be the same for each group (or individual) that does this project. However, I would not expect to see the same results for any two groups (or individuals) samples since they are created using the Random number generator (RNG) mentioned below. This is a detailed and important project in this course, start early and take the time to do a good job. This assignment is worth twice what any one exam is worth. 1) Draw a random sample of 50 from the full population provided by using the Random number generator (RNG) in Excel as a random sampling method (see my example of the RNG under Course documents). After creating the sample of fifty paste it here under this question. 2) Describe how the random sample was taken. Discuss. This is the place that you discuss how you did number 1 above. Be detailed. Refer to the instructions for the RNG that are provided in the Excel document. 3) Determine the mean, mode, median, variance, standard deviation, high value, low value and range for years of seniority, base salary, commission and total salary for your SAMPLE. Save yourself some work here by using the Excel Descriptive statistics function. 4) Determine the mean, mode, median, variance, standard deviation, high value, low value and range for years of seniority, base salary, commission and total salary for the POPULATION. Save yourself some work here by using the Excel Descriptive statistics function. 5) Briefly explain the differences between the population and your sample. Discuss. I am looking for a paragraph or so here of prose. I would expect more than a few sentences.
Step by Step Solution
There are 3 Steps involved in it
Step: 1

Get Instant Access to Expert-Tailored Solutions
See step-by-step solutions with expert insights and AI powered tools for academic success
Step: 2

Step: 3

Ace Your Homework with AI
Get the answers you need in no time with our AI-driven, step-by-step assistance
Get Started


