

Question: Draw the p - v diagram for substance Water Draw the blue line for saturated liquid & the red line for saturated vapor 3 .
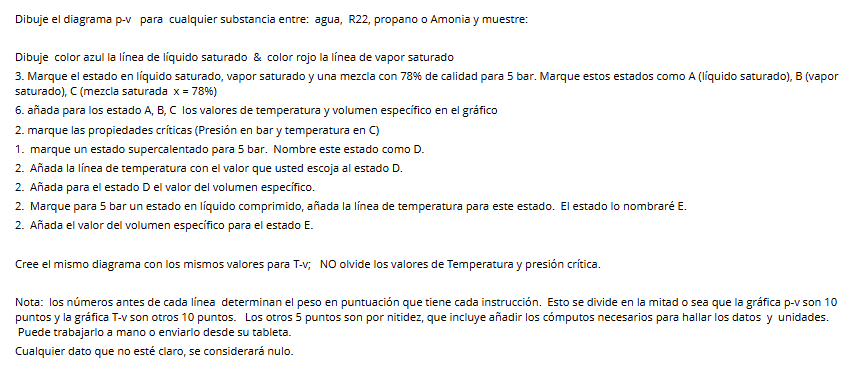
Draw the pv diagram for substance Water
Draw the blue line for saturated liquid & the red line for saturated vapor
Mark the state in saturated liquid, saturated vapor and a mixture with quality for bar. Mark these states as A saturated liquid B saturated vapor C saturated mixture x
Add for the states A B C the values of temperature and specific volume on the graph
Mark the critical properties Pressure in bar and temperature in C
Mark a superheated state for bar. Name this state as D
Add the temperature line with the value you choose to state D
Add for state D the value of specific volume.
Mark for bar a state in compressed liquid, add the temperature line for this state. I'll name the state E
Add the value for the specific volume for state E
Create the same diagram with the same values for Tv; DO NOT forget the values for Temperature and Critical Pressure.
Note: The numbers before each line determine the scoring weight that each instruction has. This is divided in half, so the pv graph is points and the Tv graph is another points. The other points are for clarity, which includes adding the necessary calculations to find the data and units. You can work this out by hand or send it from your tablet.
Any data that is not clear will be considered void.
Step by Step Solution
There are 3 Steps involved in it
1 Expert Approved Answer
Step: 1 Unlock

Question Has Been Solved by an Expert!
Get step-by-step solutions from verified subject matter experts
Step: 2 Unlock
Step: 3 Unlock