

Answered step by step
Verified Expert Solution
Question
1 Approved Answer
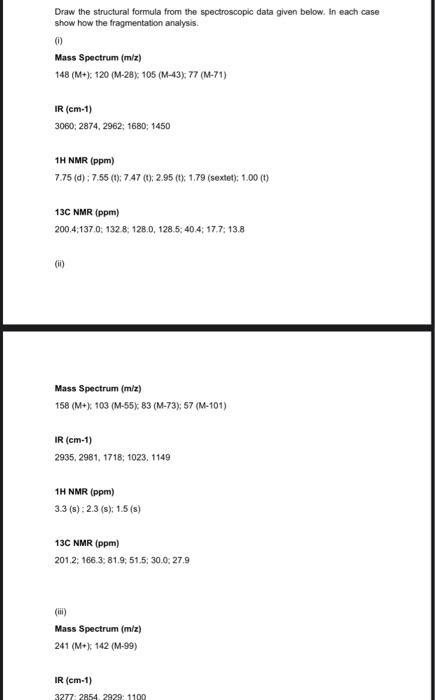
Draw the structural formula from the spectroscopic data given below. In each case show how the fragmentation analysis () Mass Spectrum (mix) 148 (M+): 120
Step by Step Solution
There are 3 Steps involved in it
Step: 1

Get Instant Access to Expert-Tailored Solutions
See step-by-step solutions with expert insights and AI powered tools for academic success
Step: 2

Step: 3
Ace Your Homework with AI
Get the answers you need in no time with our AI-driven, step-by-step assistance
Get Started
Physical Chemistry
Authors: Peter Atkins
7th Edition
978-0716735397, 716735393, 978-0716743880