

Answered step by step
Verified Expert Solution
Question
1 Approved Answer
Drop down answers i chose i think are wrong. A Debt Management Assessment Assume that you are an existing bondholder of Target Corporation (TGT), a
Drop down answers i chose i think are wrong.
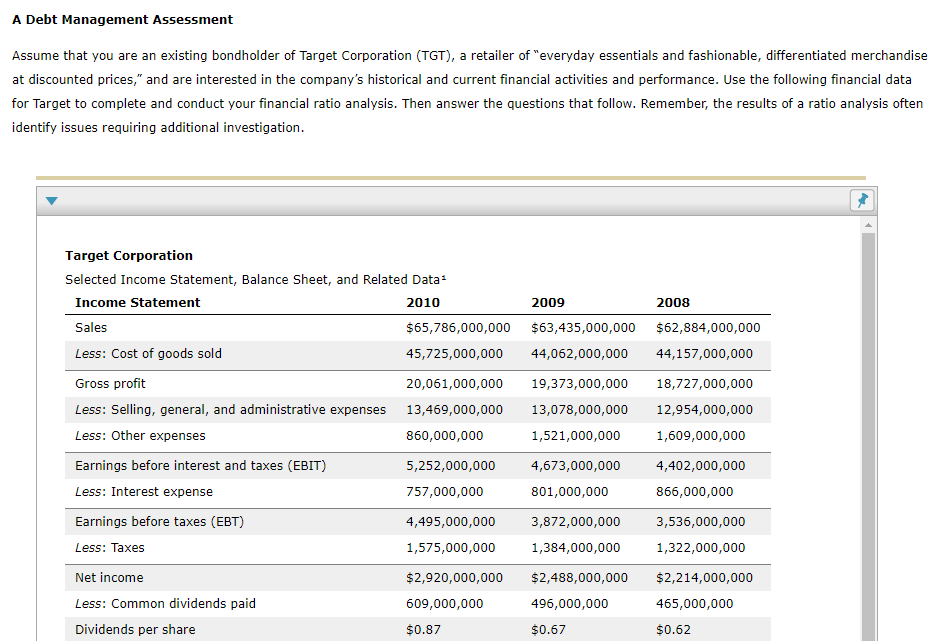
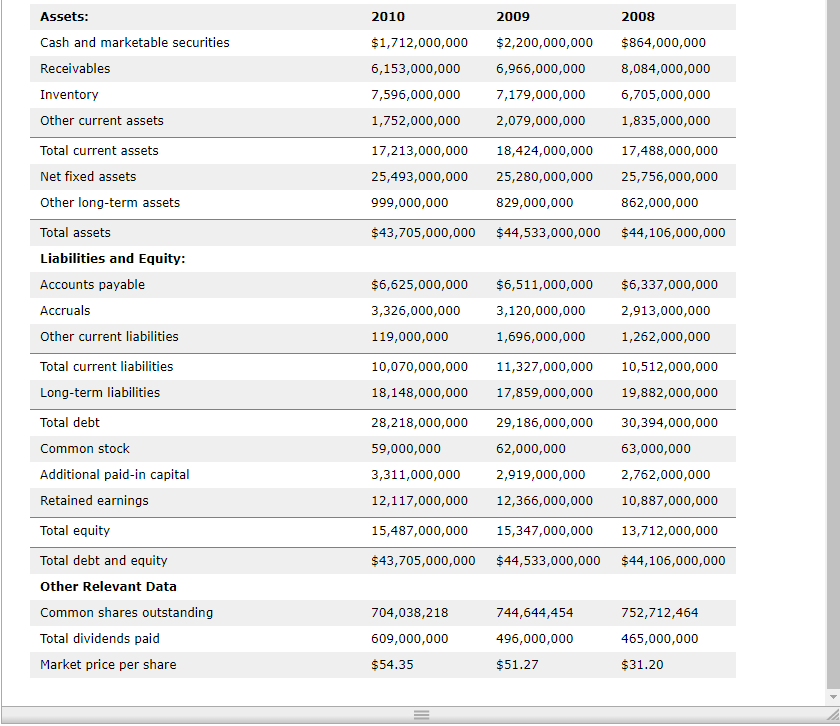
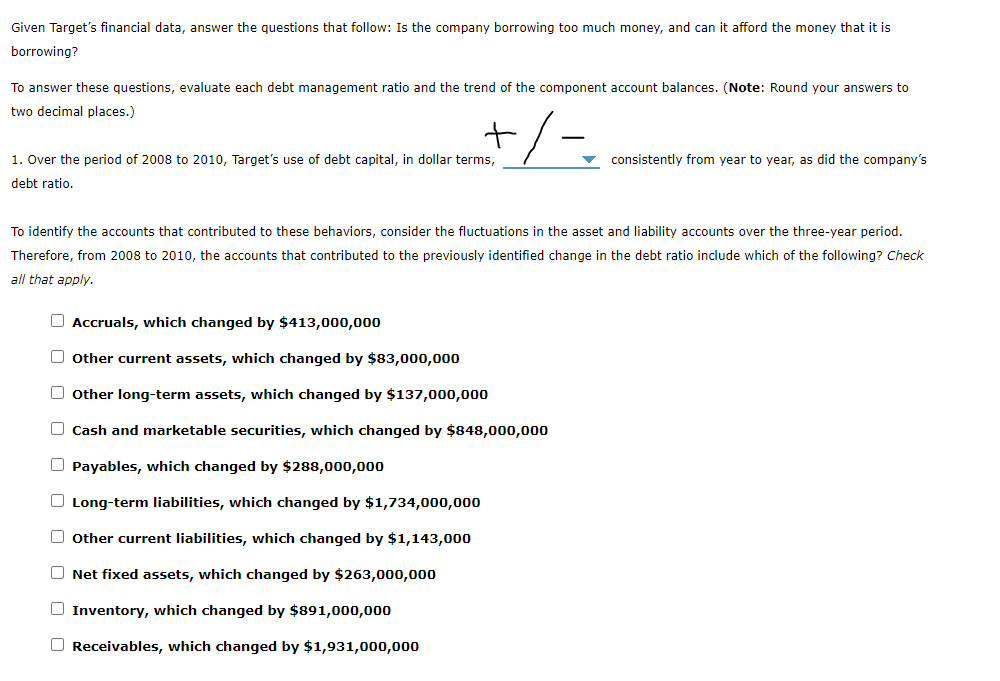
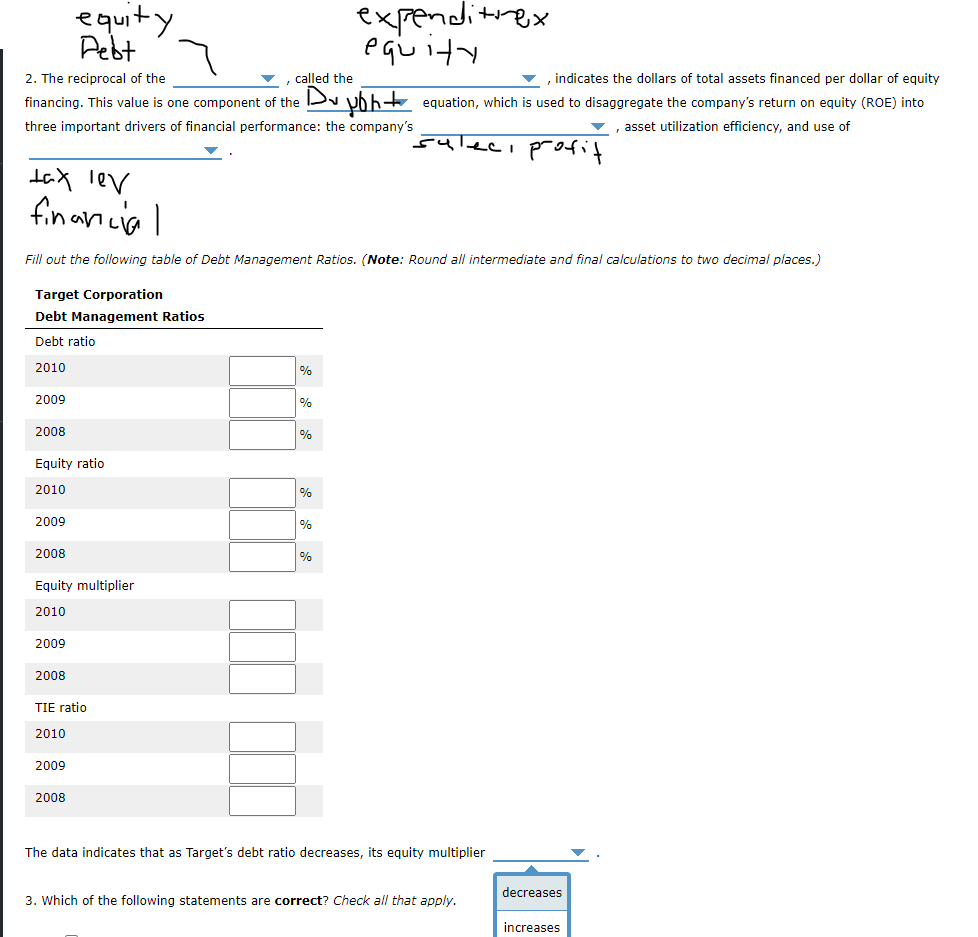
A Debt Management Assessment Assume that you are an existing bondholder of Target Corporation (TGT), a retailer of "everyday essentials and fashionable, differentiated merchandise at discounted prices," and are interested in the company's historical and current financial activities and performance. Use the following financial data for Target to complete and conduct your financial ratio analysis. Then answer the questions that follow. Remember, the results of a ratio analysis often identify issues requiring additional investigation. Target Corporation Selected Income Statement, Balance Sheet, and Related Data: Income Statement 2010 2009 $65,786,000,000 $63,435,000,000 Less: Cost of goods sold 45,725,000,000 44,062,000,000 2008 Sales $62,884,000,000 44,157,000,000 20,061,000,000 13,469,000,000 860,000,000 19,373,000,000 13,078,000,000 1,521,000,000 18,727,000,000 12,954,000,000 1,609,000,000 Gross profit Less: Selling, general, and administrative expenses Less: Other expenses Earnings before interest and taxes (EBIT) Less: Interest expense Earnings before taxes (EBT) Less: Taxes 5,252,000,000 757,000,000 4,673,000,000 801,000,000 4,402,000,000 866,000,000 4,495,000,000 1,575,000,000 3,872,000,000 1,384,000,000 3,536,000,000 1,322,000,000 Net income $2,488,000,000 $2,920,000,000 609,000,000 $2,214,000,000 465,000,000 496,000,000 Less: Common dividends paid Dividends per share $0.87 $0.67 $0.62 2010 2009 2008 Assets: Cash and marketable securities Receivables Inventory Other current assets $1,712,000,000 6,153,000,000 7,596,000,000 1,752,000,000 $2,200,000,000 6,966,000,000 7,179,000,000 2,079,000,000 $864,000,000 8,084,000,000 6,705,000,000 1,835,000,000 Total current assets Net fixed assets Other long-term assets 17,213,000,000 25,493,000,000 999,000,000 18,424,000,000 25,280,000,000 17,488,000,000 25,756,000,000 862,000,000 829,000,000 Total assets $43,705,000,000 $44,533,000,000 $44,106,000,000 Liabilities and Equity: Accounts payable Accruals Other current liabilities Total current liabilities Long-term liabilities $6,625,000,000 3,326,000,000 119,000,000 $6,511,000,000 3,120,000,000 1,696,000,000 $6,337,000,000 2,913,000,000 1,262,000,000 10,070,000,000 18,148,000,000 11,327,000,000 17,859,000,000 10,512,000,000 19,882,000,000 29,186,000,000 30,394,000,000 63,000,000 62,000,000 Total debt Common stock Additional paid-in capital Retained earnings 28,218,000,000 59,000,000 3,311,000,000 12,117,000,000 2,919,000,000 12,366,000,000 2,762,000,000 10,887,000,000 15,487,000,000 15,347,000,000 13,712,000,000 $43,705,000,000 $44,533,000,000 $44,106,000,000 Total equity Total debt and equity Other Relevant Data Common shares outstanding Total dividends paid Market price per share 704,038,218 609,000,000 744,644,454 496,000,000 752,712,464 465,000,000 $54.35 $51.27 $31.20 Given Target's financial data, answer the questions that follow: Is the company borrowing too much money, and can it afford the money that it is borrowing? To answer these questions, evaluate each debt management ratio and the trend of the component account balances. (Note: Round your answers to two decimal places.) +/- consistently from year to year, as did the company's 1. Over the period of 2008 to 2010, Target's use of debt capital, in dollar terms, debt ratio. To identify the accounts that contributed to these behaviors, consider the fluctuations in the asset and liability accounts over the three-year period. Therefore, from 2008 to 2010, the accounts that contributed to the previously identified change in the debt ratio include which of the following? Check all that apply. Accruals, which changed by $413,000,000 Other current assets, which changed by $83,000,000 Other long-term assets, which changed by $137,000,000 Cash and marketable securities, which changed by $848,000,000 Payables, which changed by $288,000,000 Long-term liabilities, which changed by $1,734,000,000 Other current liabilities, which changed by $1,143,000 0 0 0 0 0 Net fixed assets, which changed by $263,000,000 Inventory, which changed by $891,000,000 Receivables, which changed by $1,931,000,000 2. The reciprocal of the called the indicates the dollars of total assets financed per dollar of equity equity expenditrex Debt equity financing. This value is one component of the Dupon to equation, which is used to disaggregate the company's return on equity (ROE) into suleci profit tax lev financial three important drivers of financial performance: the company's , asset utilization efficiency, and use of Fill out the following table of Debt Management Ratios. (Note: Round all intermediate and final calculations to two decimal places.) Target Corporation Debt Management Ratios Debt ratio 2010 % 2009 % 2008 % Equity ratio 2010 % 2009 % 2008 % Equity multiplier 2010 2009 2008 TIE ratio 2010 2009 2008 The data indicates that as Target's debt ratio decreases, its equity multiplier decreases 3. Which of the following statements are correct? Check all that apply. increases 3. Which of the following statements are correct? Check all that apply. The behavior of the debt ratio at least partially explains the 7.16% reduction in the Total Debt account between 2008 and 2010. The behavior of the equity ratio and the equity multiplier at least partially explains the 0.91% reduction in the Total Asset account between 2008 and 2010. The trend of the firm's TIE ratio will not be interpreted as good news by Target's interest-earning creditors. One contributing factor to the observed behavior of the TIE ratio is the trend in Target's interest expense. The behavior of the debt ratio at least partially explains the observed behavior of Target's Other Current liabilities account between 2008 and 2010Step by Step Solution
There are 3 Steps involved in it
Step: 1

Get Instant Access to Expert-Tailored Solutions
See step-by-step solutions with expert insights and AI powered tools for academic success
Step: 2

Step: 3
Ace Your Homework with AI
Get the answers you need in no time with our AI-driven, step-by-step assistance
Get Started
Auditing Sustainable Development Goals Key Principles And Tools For Supply Chain
Authors: Barden Gonzalez
1st Edition
B0BZFDM86C, 979-8388651501