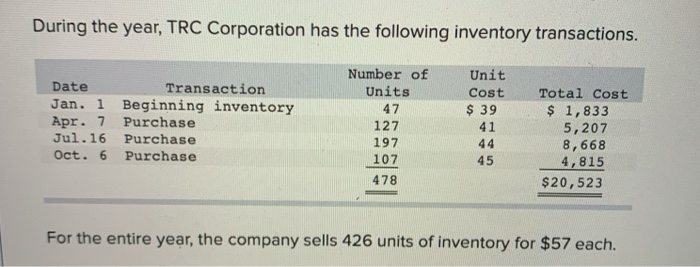
During the year, TRC Corporation has the following inventory transactions. Date Transaction Jan. 1 Beginning inventory Apr. 7 Purchase Jul.16 Purchase Oct. 6 Purchase Number of Units 47 127 197 107 478 Unit Cost $ 39 41 Total Cost $ 1,833 5, 207 8,668 4,815 $20,523 45 For the entire year, the company sells 426 units of inventory for $57 each. FIFO Cost of Goods Available for Sale Cost of Goods Sold Ending Inventory Cost per # of units unit Cost of Goods Sold Cost of Goods Cost # of units per Available unit for Sale 76 $ 3,572 63 76 # of units Cost Ending per unit Inventory 47 4,788 Beginning Inventory Purchases: Apr. 7 Jul.16 Oct.6 124 $ 41 124 $ 41 5,084 8,668 197 $ 5,084 0 44 $ 44 107 $ 45 $ 45 0 Total 475 4,815 22,139 Sales revenue Gross profit 2. Using LIFO, calculate ending inventory, cost of goods sold, sales revenue, and gross profit. Cost of Goods Sold Ending Inventory Cost per Cost per # of units Cost of Goods Sold # of units unit Cost Ending per unit Inventory LIFO Cost of Goods Available for Sale Cost of # of units Goods unit Available for Sale Beginning Inventory $ 0 Purchases: Apr 07 0 Jul 16 Oct 06 Total 0 $ OOO 5 Sales revenue Gross profit 3. Using weighted-average cost, calculate ending inventory, cost of goods sold, sales revenue, and gross profit. (Round "Average Cost per unit" to 4 decimal places and all other answers to the nearest whole number.) Ending Inventory - Weighted Average Cost Weighted Average Cost of Goods Available for Sale Cost of Goods Sold - Weighted Average Cost Cost per Cost of Goods # of units Available for of units unit Cost of Cost per Unit Sold Sale Goods Sold Cost # of units in Ending Inventory Cost per unit Ending Inventory 47 $ 1,833 Beginning Inventory Purchases Apr 07 Jul 16 Oct 00 Total 127 197 107 5.207 8,668 4,815 20.523 478 Sales revenue Gross proft Determine which method will result in higher profitability when inventory costs are rising Multiple Choice FIFO LIFO Weighted average