

Question
Dynamic Programing - City Planning. A city planner is asked to organize grocery shops in a new city. The city has a straight line main
Dynamic Programing - City Planning. A city planner is asked to organize grocery shops in a new city. The city has a straight line main street that goes throughout the city. The city planner is asked to position where should the city provide permits to build new grocery shops so that people of the new city can have the shortest distance to their grocery markets. The population density is not constant along both sides of the main street. A higher density is around multiple city centers or crossroads along side the main street.
Your task is to develop an algorithm, given the positions of the city centers and the number of grocery shops, computes the least possible sum of all distances between each city centers and its nearest grocery shop.
Input to your Algorithm:
- List of city centers coordinate positions along the main street (each an integer number
- between 1 and 1000). This is a sequence of numbers.
- Number of city centers is an integer between 2 and 100.
- Number of grocery shops (an integer number between 2 and 30).
- The number of shops is smaller than the number of city centers.
Output of your algorithm: A single integer, which is the sum of all distances between each city center and its nearest grocery market.
Sample Input:
5
[1 2 3 6 7 9 11 21 40 50]
Sample Output:
9
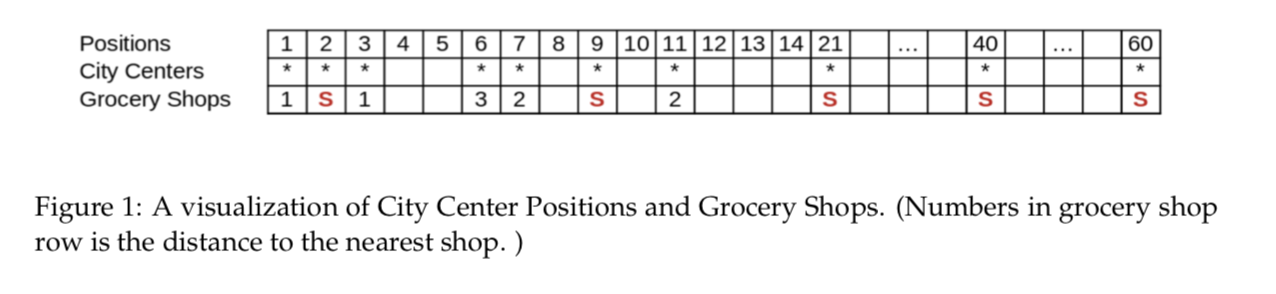
Figure 1: A visualization of City Center Positions and Grocery Shops. (Numbers in grocery shop row is the distance to the nearest shop. )
Tasks:
- Task 2.1. What are the sub-problems in this case? What is the counts of sub-problems? Provide a brief description of your solution.
- Task 2.2. Write up your algorithm in Pseudocode or python implementation.
- Task 2.3. What is the run time complexity of your algorithm?
4 | 5 6 7 8 9 10 11 12 13 1421 40 60 1 2 3 * * * * * * * Positions City Centers Grocery Shops * 1s 1 3 2 s 2 S S S Figure 1: A visualization of City Center Positions and Grocery Shops. (Numbers in grocery shop row is the distance to the nearest shop. ) 4 | 5 6 7 8 9 10 11 12 13 1421 40 60 1 2 3 * * * * * * * Positions City Centers Grocery Shops * 1s 1 3 2 s 2 S S S Figure 1: A visualization of City Center Positions and Grocery Shops. (Numbers in grocery shop row is the distance to the nearest shop. )
Step by Step Solution
There are 3 Steps involved in it
Step: 1

Get Instant Access to Expert-Tailored Solutions
See step-by-step solutions with expert insights and AI powered tools for academic success
Step: 2

Step: 3
Ace Your Homework with AI
Get the answers you need in no time with our AI-driven, step-by-step assistance
Get Started
Database Design Application Development And Administration
Authors: Michael V. Mannino
4th Edition
0615231047, 978-0615231044