

Answered step by step
Verified Expert Solution
Question
1 Approved Answer
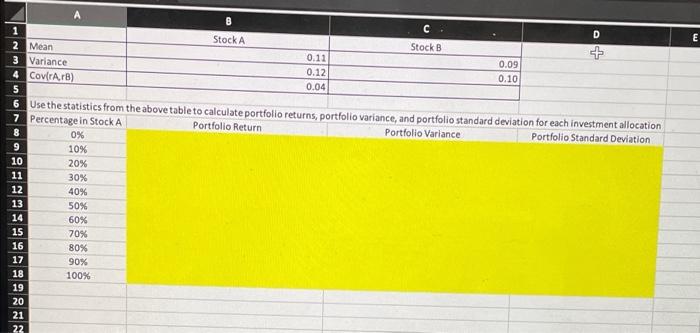
E 1 StockA 2 Mean Stock B 0.11 3 Variance 0.09 0.12 4 Cover) 0.10 0.04 5 6 Use the statistics from the above table
Step by Step Solution
There are 3 Steps involved in it
Step: 1

Get Instant Access to Expert-Tailored Solutions
See step-by-step solutions with expert insights and AI powered tools for academic success
Step: 2

Step: 3
Ace Your Homework with AI
Get the answers you need in no time with our AI-driven, step-by-step assistance
Get Started
The Oxford Handbook Of State Capitalism And The Firm
Authors: Mike Wright, Geoffrey T. Wood, Alvaro Cuervo-Cazurra, Pei Sun, Ilya Okhmatovskiy, Anna Grosman
1st Edition
0198837364, 978-0198837367