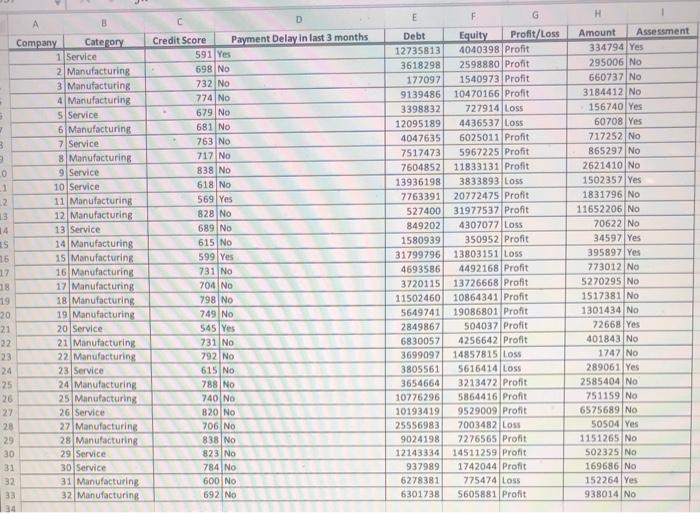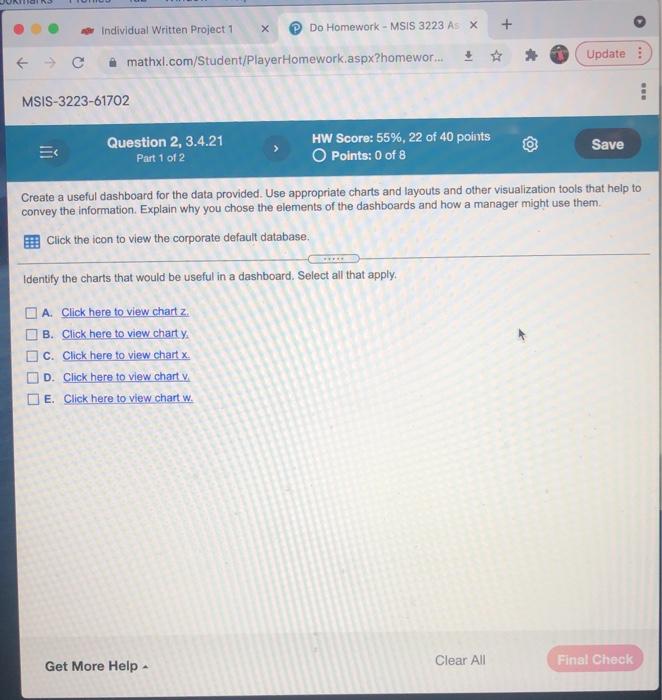
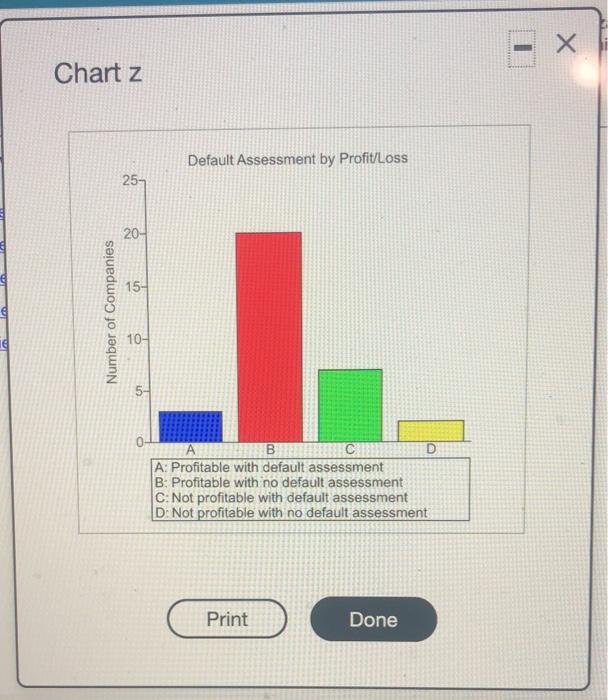
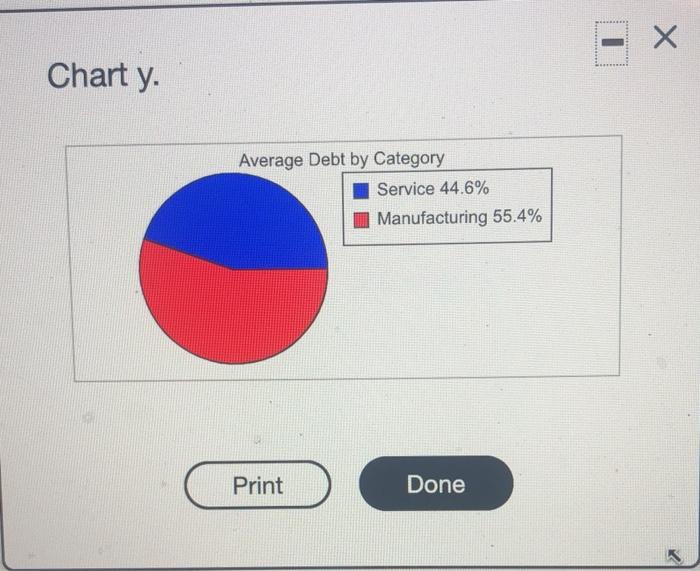
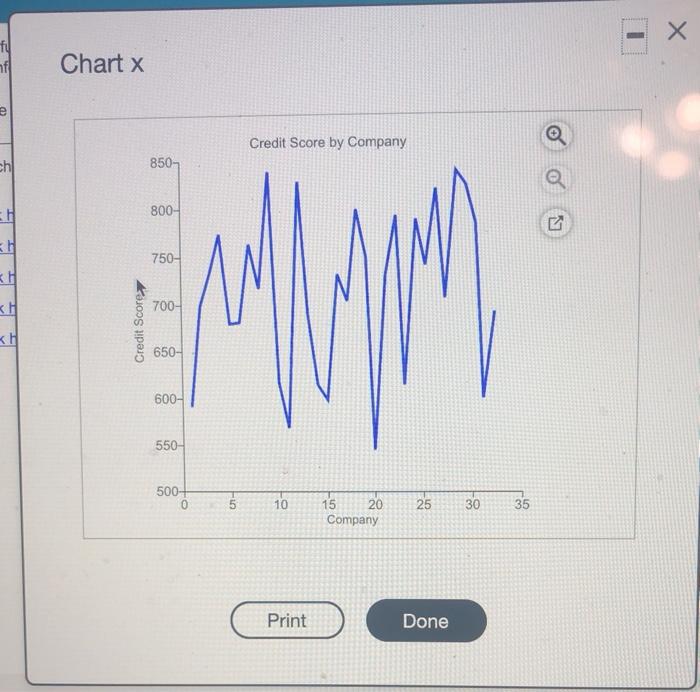
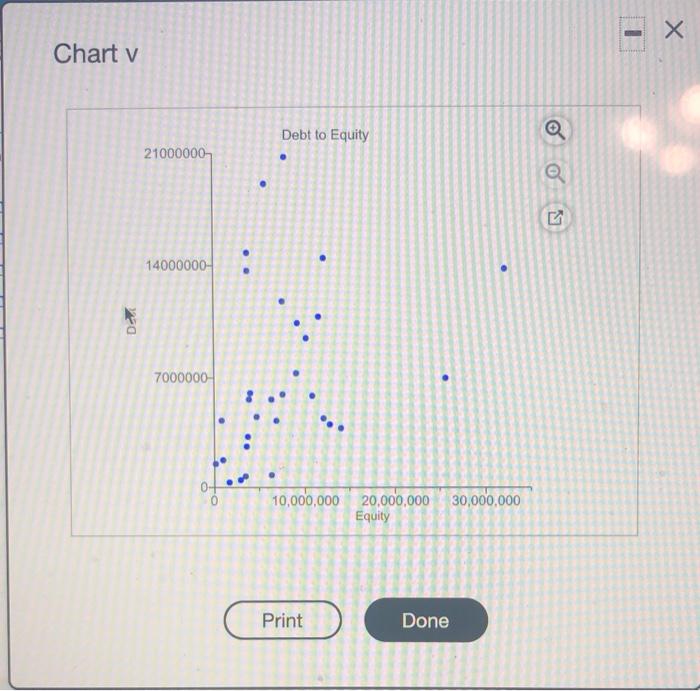
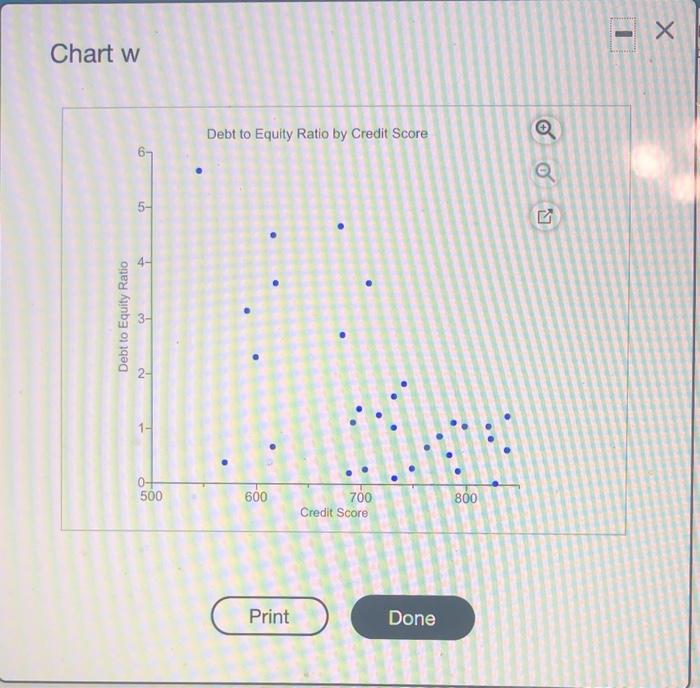
E F G H B Company Category 1 Service 2 Manufacturing 3 Manufacturing . 4 Manufacturing S Service 7 6 Manufacturing 8 7 Service 8 Manufacturing 0 9 Service 1 10 Service 2 11 Manufacturing 13 12 Manufacturing 14 13 Service 15 14 Manufacturing 16 15 Manufacturing 17 16 Manufacturing 18 12 Manufacturing 19 18 Manufacturing 20 19 Manufacturing 21 20 Service 22 21 Manufacturing 23 22 Manufacturing 24 23 Service 25 24 Manufacturing 26 25 Manufacturing 27 26 Service 28 27 Manufacturing 29 28 Manufacturing 30 29 Service 31 30 Service 32 31 Manufacturing 33 32 Manufacturing 34 D Credit Score Payment Delay in last 3 months 591 Yes 698 No 732 No 774 NO 679 No 681 No 763 No 717 No 838 No 618 No 569 Yes 828 No 689 No 615 No 599 Yes 731 No 704 No 798 No 749 No 545 Yes 731 NO 792 No 615 No 788 NO 740 No 820 NO 706 No 838 No 823 No 784 No 600 No 692 No Debt 12735813 3618298 177097 9139486 3398832 12095189 4047635 7517473 7604852 13936198 7763391 527400 849202 1580939 31799796 4693586 3720115 11502460 5649741 2849867 6830057 3699097 3805561 3654664 10776296 10193419 25556983 9024198 12143334 937989 6278381 6301738 Equity Profit/Loss 4040398 Profit 2598880 Profit 1540973 Profit 10470166 Profit 727914 Loss 4436537 LOSS 6025011 Profit 5967225 Profit 11833131 Profit 3833893 Loss 20772475 Profit 31977537 Profit 4307077 Loss 350952 Profit 13803151 LOSS 4492168 Profit 13726668 Profit 10864341 Profit 19086801 Profit 504037 Profit 4256642 Profit 14857815 Loss 5616414 LOSS 3213472 Profit 5864416 Profit 9529009 Profit 7003482 LOSS 7276565 Profit 14511259 Profit 1742044 Profit 775474 Loss 5605881 Profit Amount Assessment 334794 Yes 295006 No 660737 No 3184412 No 156740 Yes 60708 Yes 717252 No 865297 No 2621410 NO 1502357 Yes 1831796 No 11652206 No 70622 No 34597 Yes 395897 Yes 773012 No 5270295 No 1517381 No 1301434 No 72668 Yes 401843 No 1747 No 289061 Yes 2585404 No 751159 No 6575689 No 50504 Yes 1151265 No 502325 No 169686 No 152264 Yes 938014 No Individual Written Project 1 X + Do Homework - MSIS 3223 AS X Update mathxl.com/Student/PlayerHomework.aspx?homewor... MSIS-3223-61702 Question 2, 3.4.21 Part 1 of 2 HW Score: 55%, 22 of 40 points O Points: 0 of 8 Save Create a useful dashboard for the data provided. Use appropriate charts and layouts and other visualization tools that help to convey the information Explain why you chose the elements of the dashboards and how a manager might use them. 2 Click the icon to view the corporate default database Identify the charts that would be useful in a dashboard. Select all that apply. A. Click here to view chart z. B. Click here to view charty, C. Click here to view chart X D. Click here to view chart E. Click here to view chart w. Get More Help Clear All Final Check Chart z Default Assessment by Profit/Loss 251 20- 15- Number of Companies id 10- LO o A B A: Profitable with default assessment B: Profitable with no default assessment C. Not profitable with default assessment D: Not profitable with no default assessment Print Done Chart y. Average Debt by Category Service 44.6% Manufacturing 55.4% Print Done X ful of Chart x Credit Score by Company ch 850 800- SH 750- yo 700- KH KH Credit Score 650- 600- 550- 500+ 0 5 10 25 30 35 15 20 Company Print Done X Chart v Debt to Equity 21000000 14000000- DAK 7000000 04 10,000,000 20,000,000 30,000,000 Equity Print Done Chart w Debt to Equity Ratio by Credit Score 6- 5 5- 4- . Debt to Equity Ratio co 2- 1- 0+ 500 600 700 Credit Score 800 Print Done E F G H B Company Category 1 Service 2 Manufacturing 3 Manufacturing . 4 Manufacturing S Service 7 6 Manufacturing 8 7 Service 8 Manufacturing 0 9 Service 1 10 Service 2 11 Manufacturing 13 12 Manufacturing 14 13 Service 15 14 Manufacturing 16 15 Manufacturing 17 16 Manufacturing 18 12 Manufacturing 19 18 Manufacturing 20 19 Manufacturing 21 20 Service 22 21 Manufacturing 23 22 Manufacturing 24 23 Service 25 24 Manufacturing 26 25 Manufacturing 27 26 Service 28 27 Manufacturing 29 28 Manufacturing 30 29 Service 31 30 Service 32 31 Manufacturing 33 32 Manufacturing 34 D Credit Score Payment Delay in last 3 months 591 Yes 698 No 732 No 774 NO 679 No 681 No 763 No 717 No 838 No 618 No 569 Yes 828 No 689 No 615 No 599 Yes 731 No 704 No 798 No 749 No 545 Yes 731 NO 792 No 615 No 788 NO 740 No 820 NO 706 No 838 No 823 No 784 No 600 No 692 No Debt 12735813 3618298 177097 9139486 3398832 12095189 4047635 7517473 7604852 13936198 7763391 527400 849202 1580939 31799796 4693586 3720115 11502460 5649741 2849867 6830057 3699097 3805561 3654664 10776296 10193419 25556983 9024198 12143334 937989 6278381 6301738 Equity Profit/Loss 4040398 Profit 2598880 Profit 1540973 Profit 10470166 Profit 727914 Loss 4436537 LOSS 6025011 Profit 5967225 Profit 11833131 Profit 3833893 Loss 20772475 Profit 31977537 Profit 4307077 Loss 350952 Profit 13803151 LOSS 4492168 Profit 13726668 Profit 10864341 Profit 19086801 Profit 504037 Profit 4256642 Profit 14857815 Loss 5616414 LOSS 3213472 Profit 5864416 Profit 9529009 Profit 7003482 LOSS 7276565 Profit 14511259 Profit 1742044 Profit 775474 Loss 5605881 Profit Amount Assessment 334794 Yes 295006 No 660737 No 3184412 No 156740 Yes 60708 Yes 717252 No 865297 No 2621410 NO 1502357 Yes 1831796 No 11652206 No 70622 No 34597 Yes 395897 Yes 773012 No 5270295 No 1517381 No 1301434 No 72668 Yes 401843 No 1747 No 289061 Yes 2585404 No 751159 No 6575689 No 50504 Yes 1151265 No 502325 No 169686 No 152264 Yes 938014 No Individual Written Project 1 X + Do Homework - MSIS 3223 AS X Update mathxl.com/Student/PlayerHomework.aspx?homewor... MSIS-3223-61702 Question 2, 3.4.21 Part 1 of 2 HW Score: 55%, 22 of 40 points O Points: 0 of 8 Save Create a useful dashboard for the data provided. Use appropriate charts and layouts and other visualization tools that help to convey the information Explain why you chose the elements of the dashboards and how a manager might use them. 2 Click the icon to view the corporate default database Identify the charts that would be useful in a dashboard. Select all that apply. A. Click here to view chart z. B. Click here to view charty, C. Click here to view chart X D. Click here to view chart E. Click here to view chart w. Get More Help Clear All Final Check Chart z Default Assessment by Profit/Loss 251 20- 15- Number of Companies id 10- LO o A B A: Profitable with default assessment B: Profitable with no default assessment C. Not profitable with default assessment D: Not profitable with no default assessment Print Done Chart y. Average Debt by Category Service 44.6% Manufacturing 55.4% Print Done X ful of Chart x Credit Score by Company ch 850 800- SH 750- yo 700- KH KH Credit Score 650- 600- 550- 500+ 0 5 10 25 30 35 15 20 Company Print Done X Chart v Debt to Equity 21000000 14000000- DAK 7000000 04 10,000,000 20,000,000 30,000,000 Equity Print Done Chart w Debt to Equity Ratio by Credit Score 6- 5 5- 4- . Debt to Equity Ratio co 2- 1- 0+ 500 600 700 Credit Score 800 Print Done
