Answered step by step
Verified Expert Solution
Question
1 Approved Answer
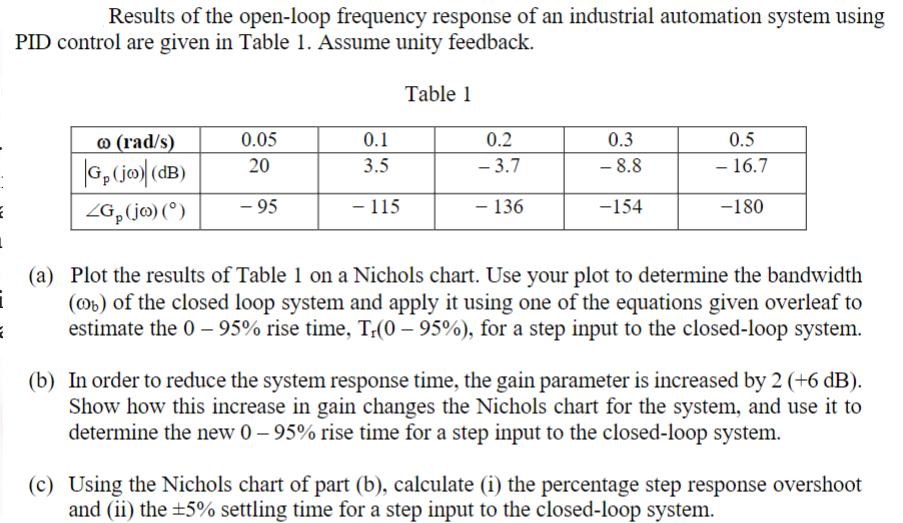
E I 1 E Results of the open-loop frequency response of an industrial automation system using PID control are given in Table 1. Assume

E I 1 E Results of the open-loop frequency response of an industrial automation system using PID control are given in Table 1. Assume unity feedback. @ (rad/s) G (jo) (dB) ZG (jo) () 0.05 20 - 95 0.1 3.5 - 115 Table 1 0.2 -3.7 - 136 0.3 -8.8 -154 0.5 - 16.7 -180 (a) Plot the results of Table 1 on a Nichols chart. Use your plot to determine the bandwidth (b) of the closed loop system and apply it using one of the equations given overleaf to estimate the 0-95% rise time, T.(0-95%), for a step input to the closed-loop system. (b) In order to reduce the system response time, the gain parameter is increased by 2 (+6 dB). Show how this increase in gain changes the Nichols chart for the system, and use it to determine the new 0-95% rise time for a step input to the closed-loop system. (c) Using the Nichols chart of part (b), calculate (i) the percentage step response overshoot and (ii) the 5% settling time for a step input to the closed-loop system.
Step by Step Solution
★★★★★
3.42 Rating (158 Votes )
There are 3 Steps involved in it
Step: 1

Get Instant Access to Expert-Tailored Solutions
See step-by-step solutions with expert insights and AI powered tools for academic success
Step: 2

Step: 3

Ace Your Homework with AI
Get the answers you need in no time with our AI-driven, step-by-step assistance
Get Started


