e Shape o The shape of the DSM will be normal if either one of the following two conditions are met: = Population from which
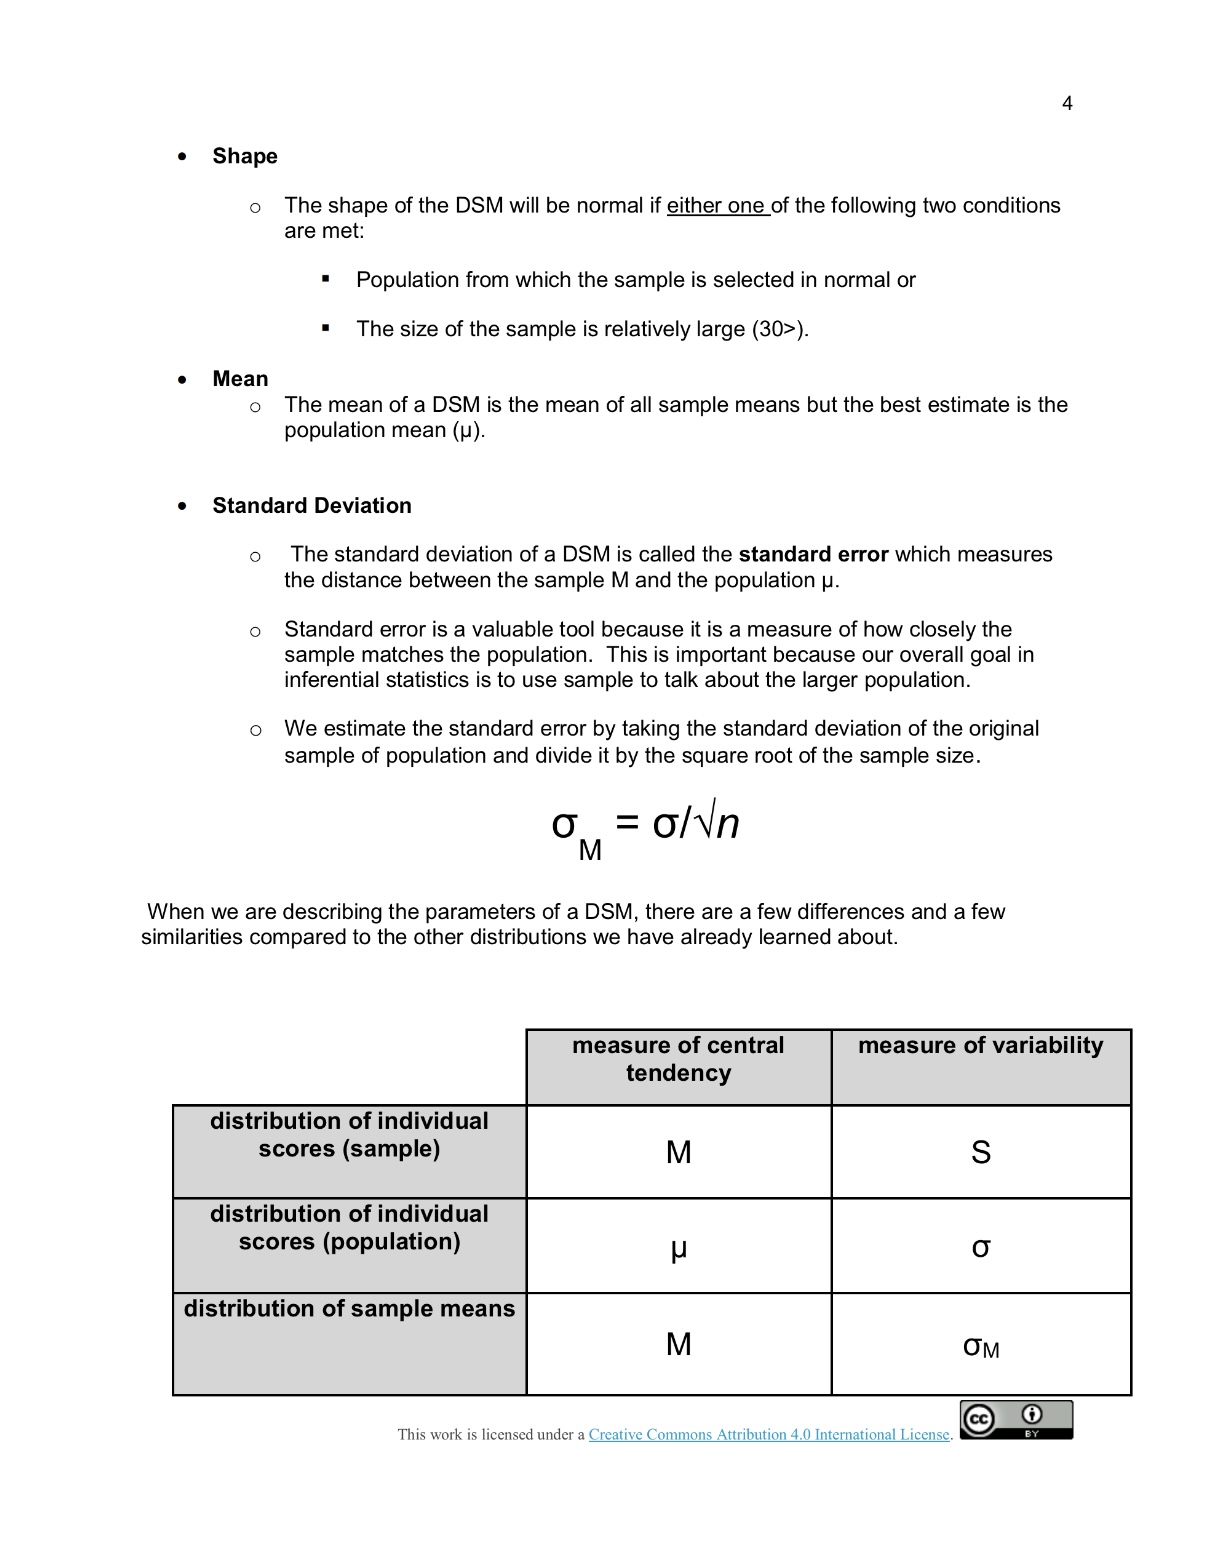
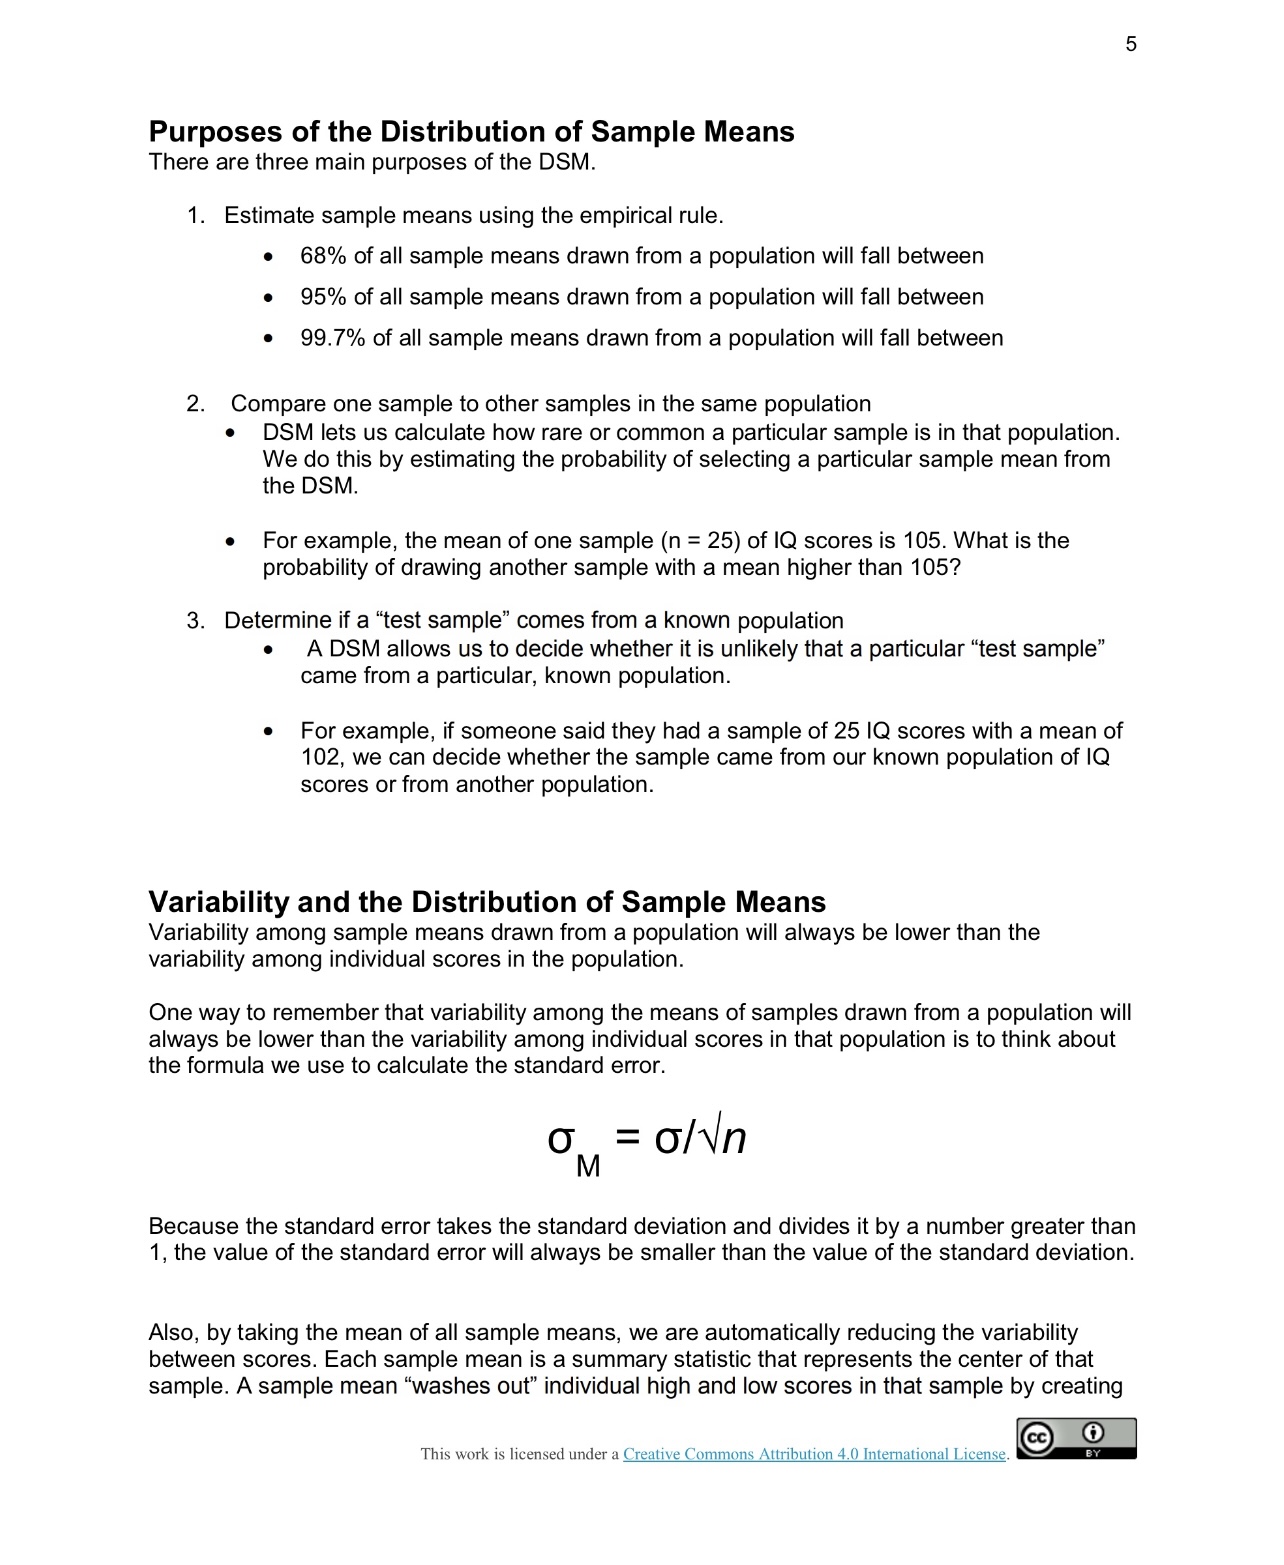
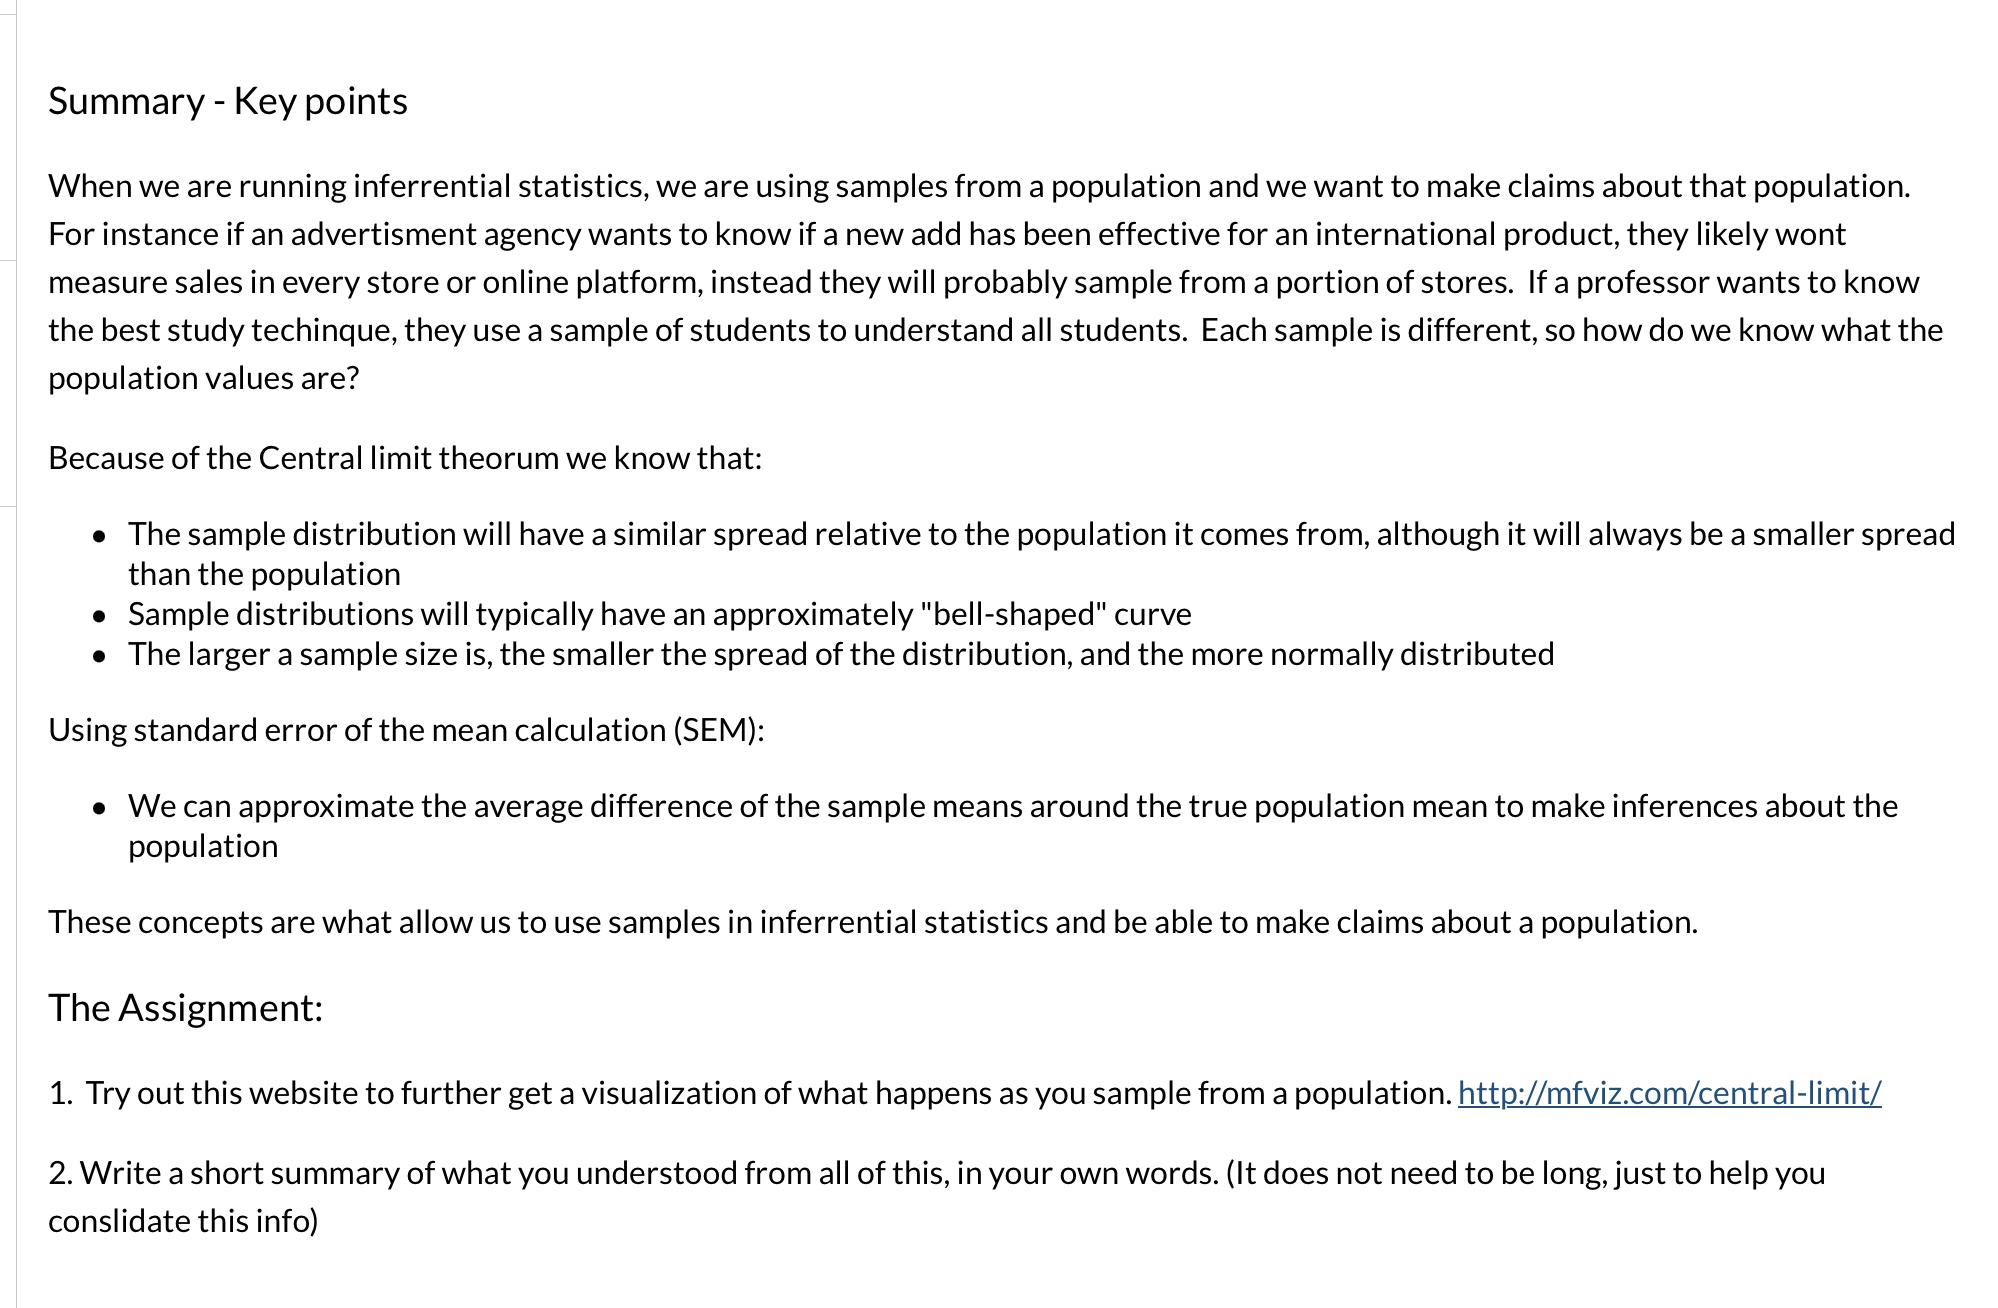
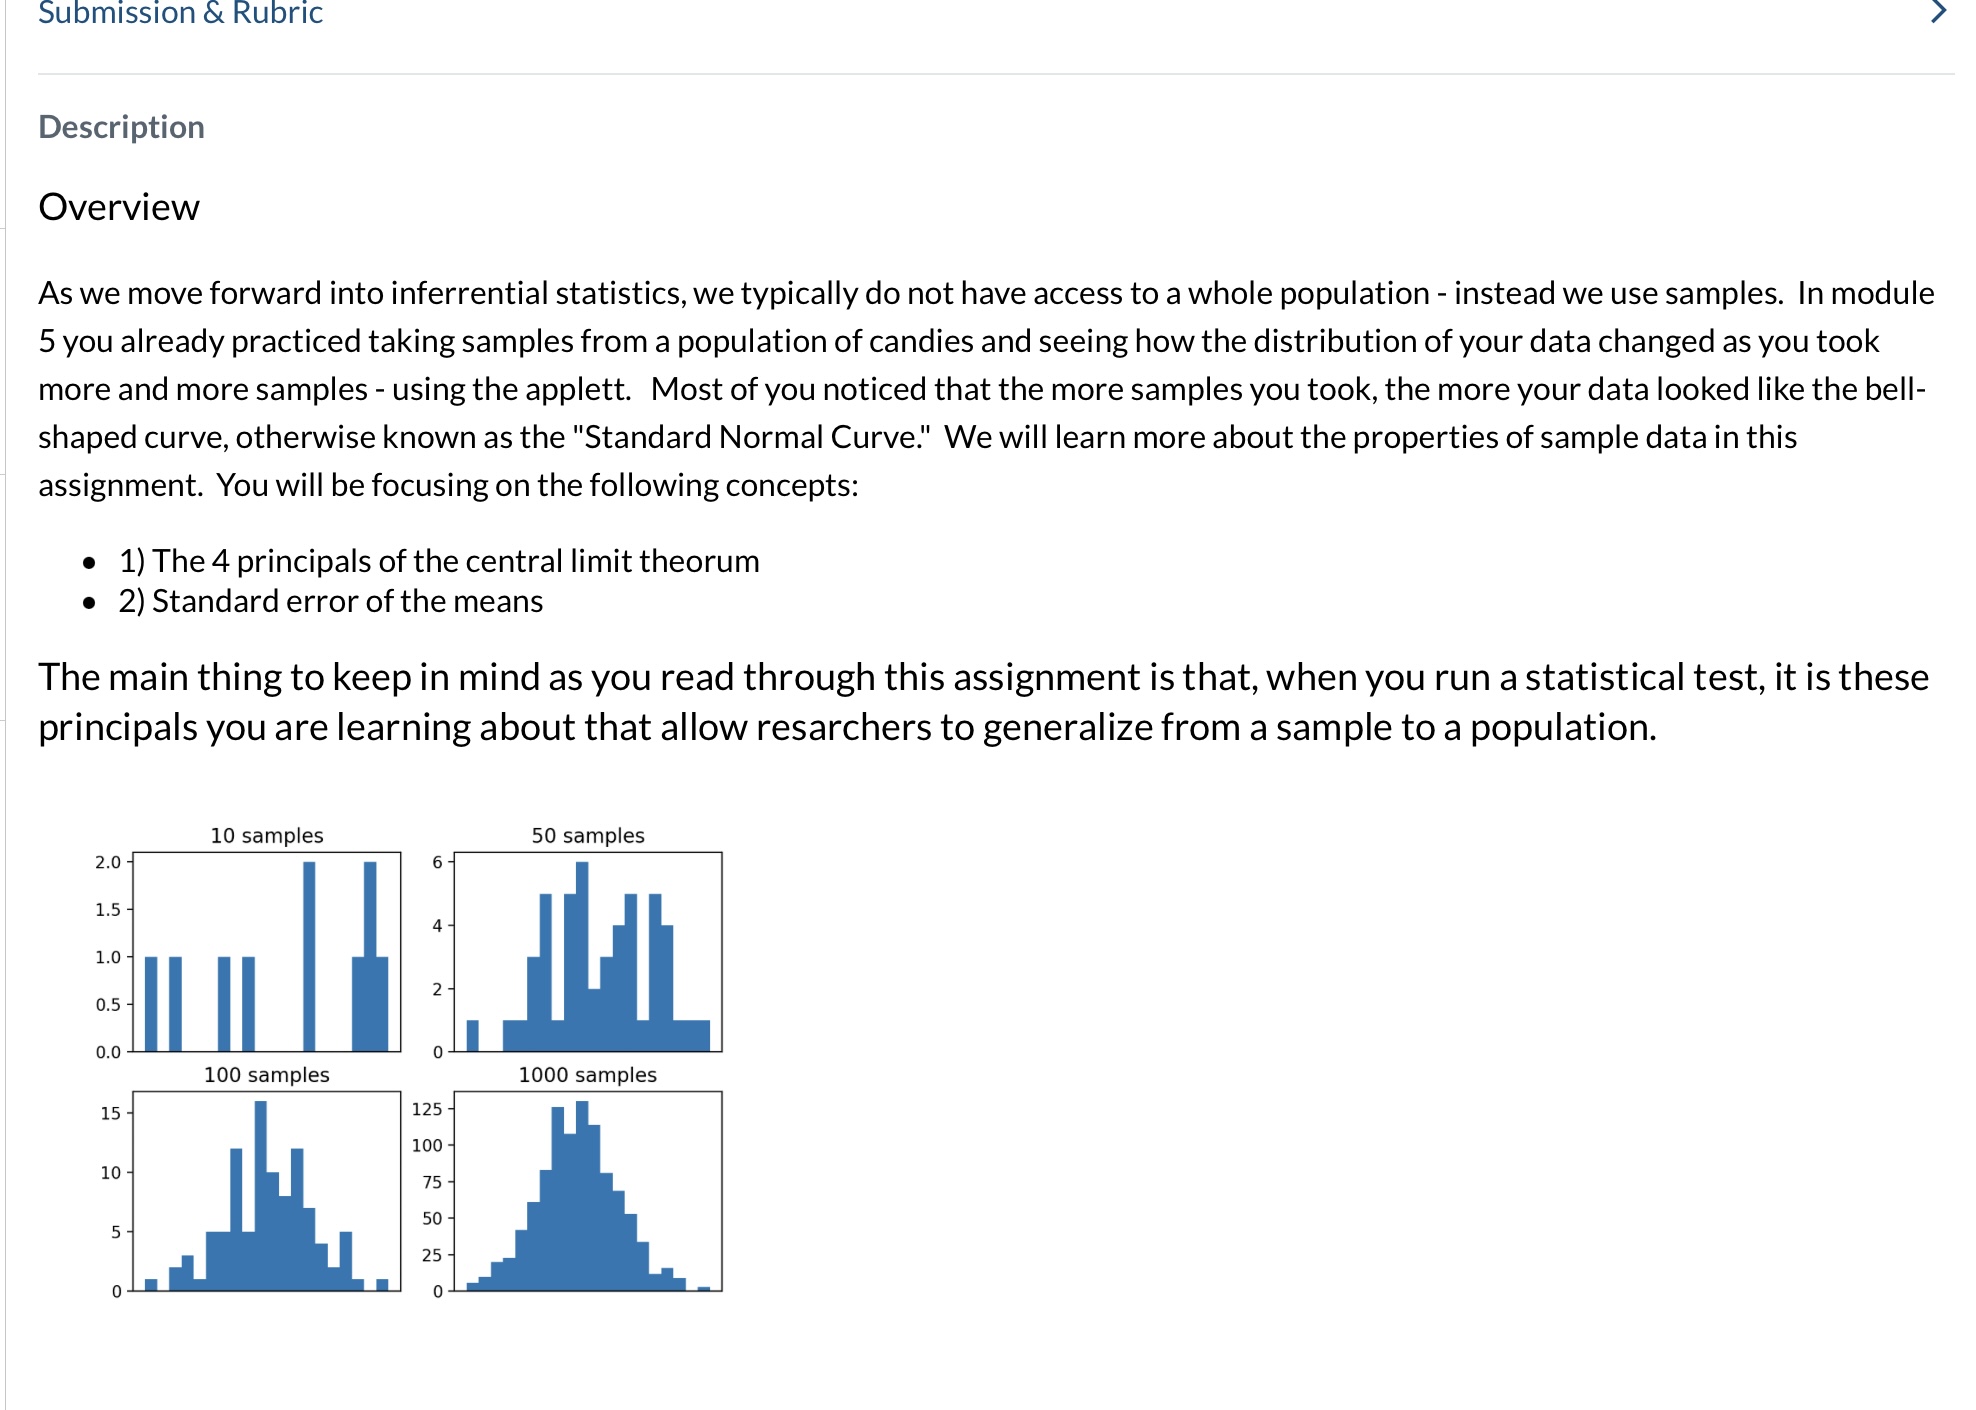
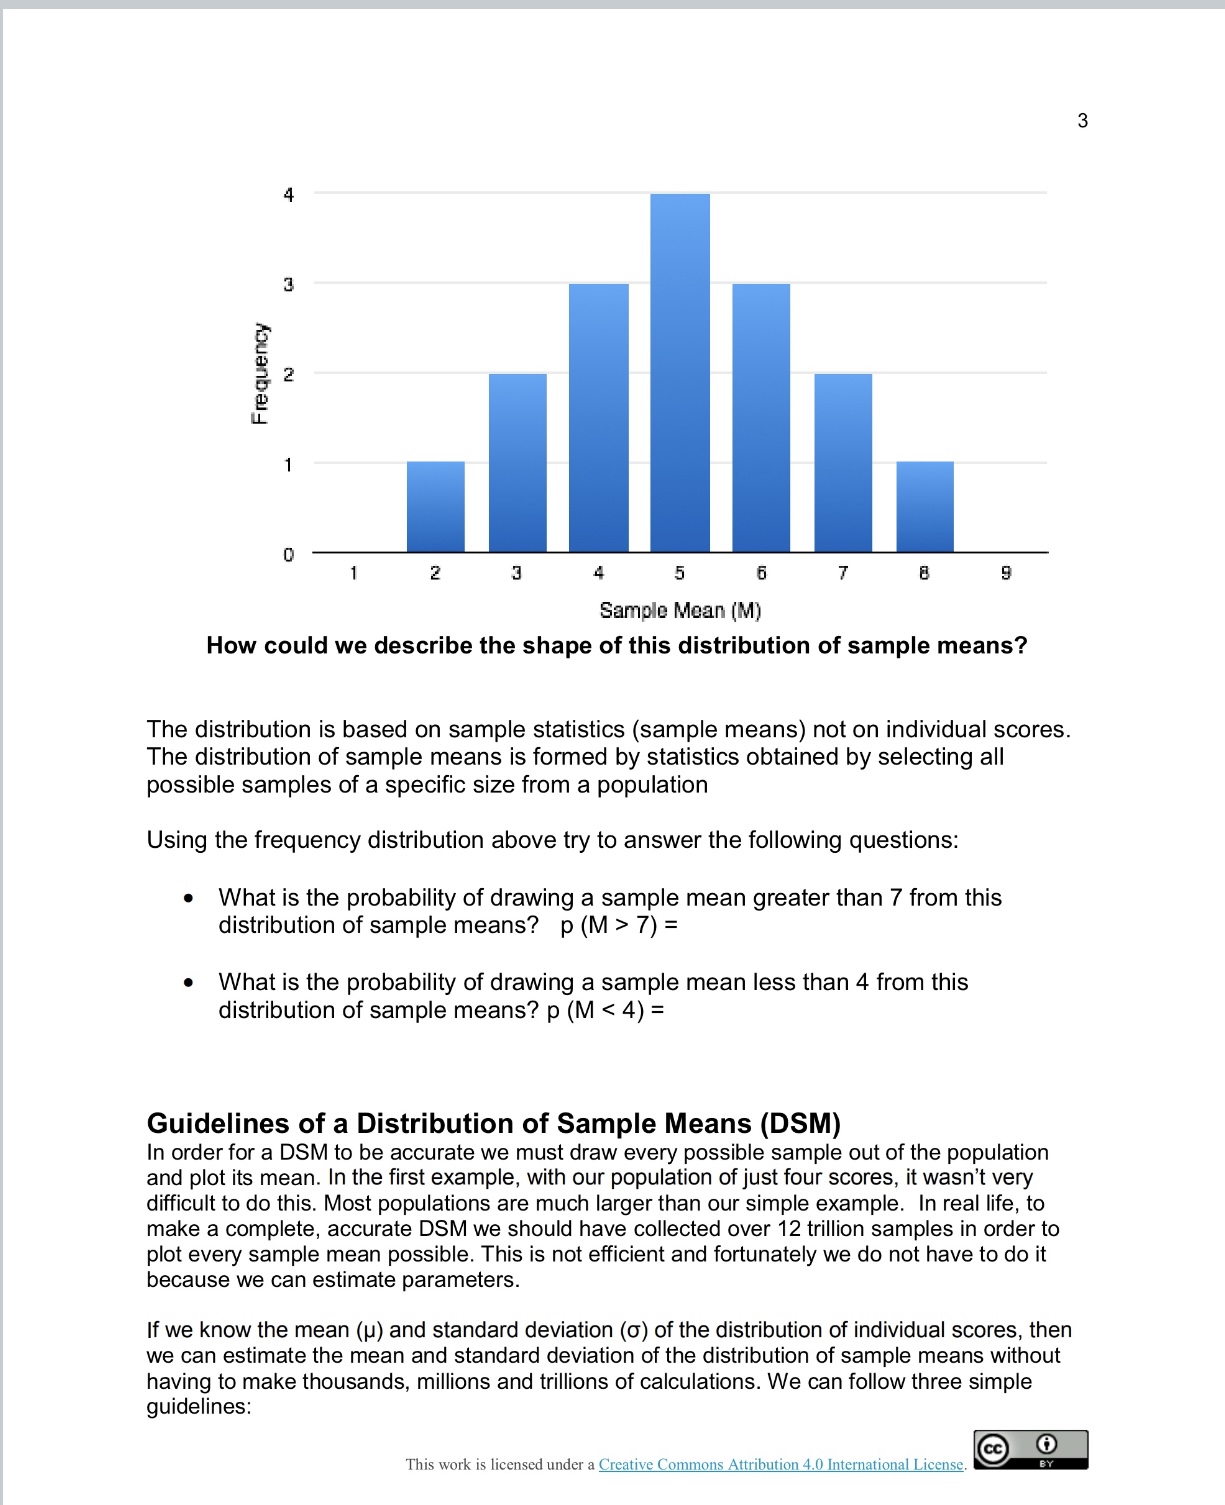
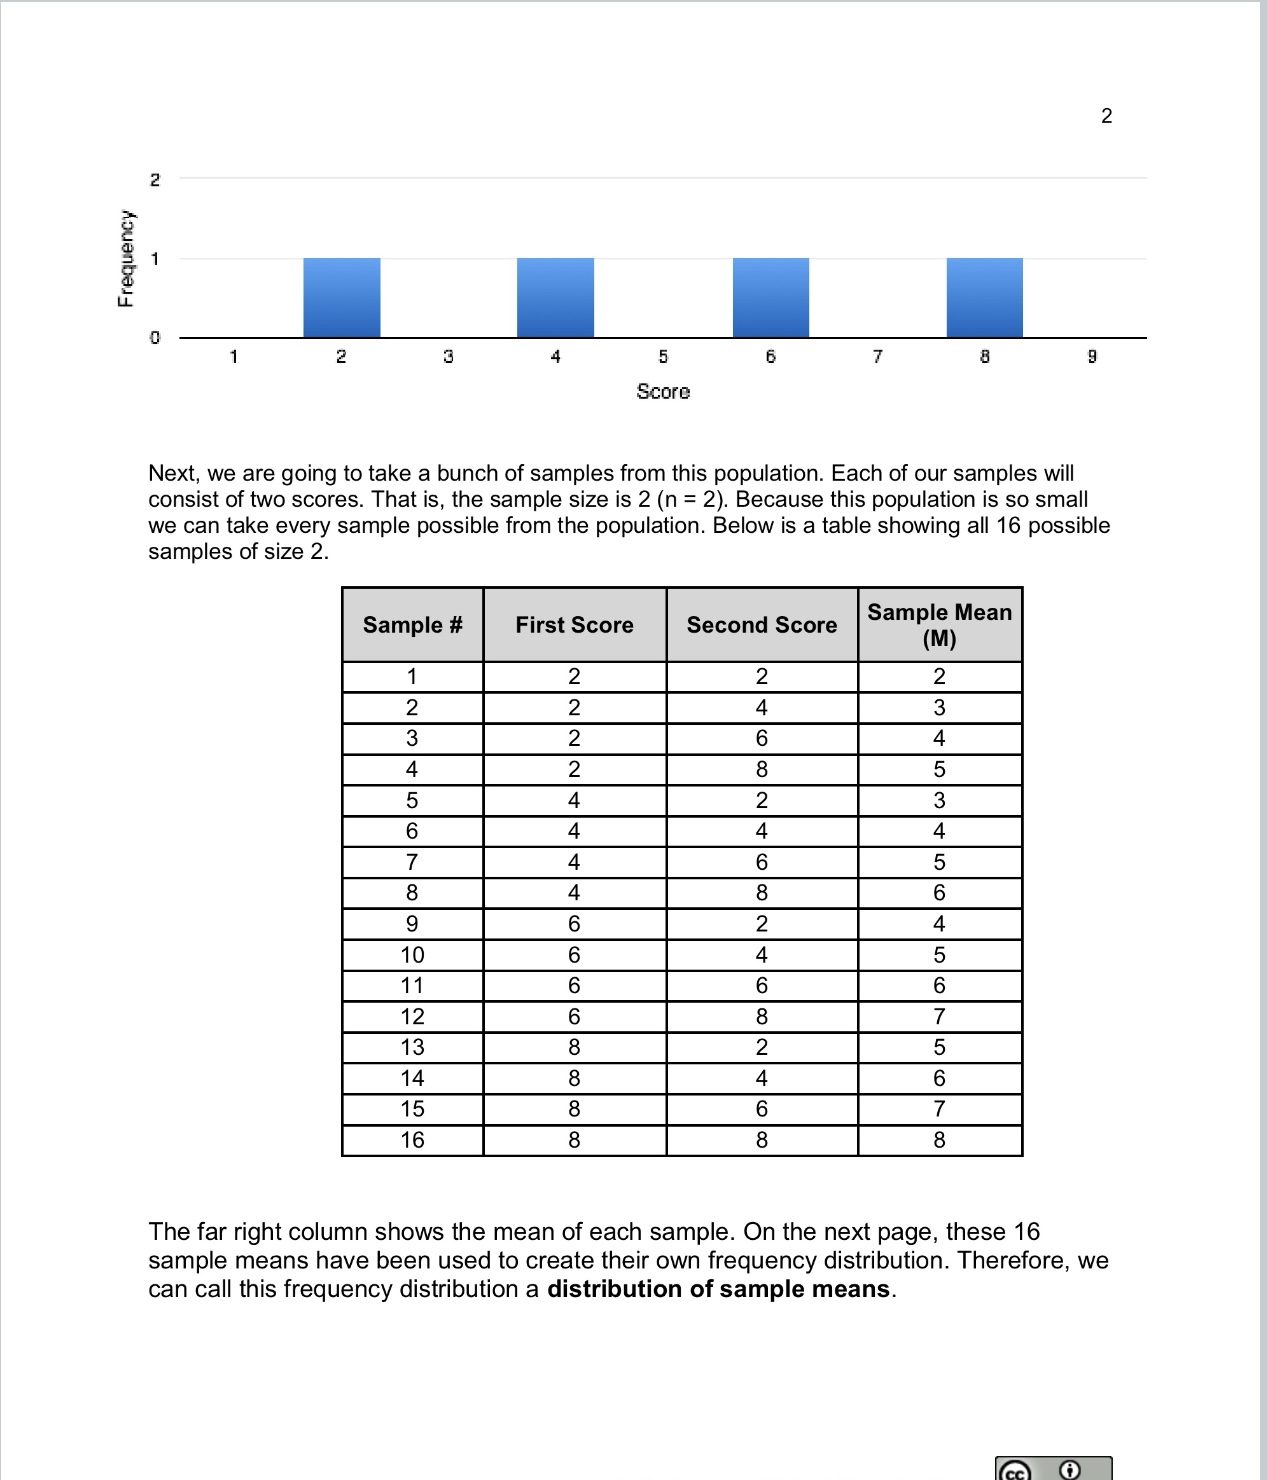
e Shape o The shape of the DSM will be normal if either one of the following two conditions are met: = Population from which the sample is selected in normal or = The size of the sample is relatively large (30>). Mean o The mean of a DSM is the mean of all sample means but the best estimate is the population mean (). e Standard Deviation o The standard deviation of a DSM is called the standard error which measures the distance between the sample M and the population p. o Standard error is a valuable tool because it is a measure of how closely the sample matches the population. This is important because our overall goal in inferential statistics is to use sample to talk about the larger population. o We estimate the standard error by taking the standard deviation of the original sample of population and divide it by the square root of the sample size. o =aol\ M When we are describing the parameters of a DSM, there are a few differences and a few similarities compared to the other distributions we have already learned about. distribution of individual measure of central tendency distribution of individual scores (population) y measure of variability distribution of sample means This work is licensed under a Creative Commons Attribution 4.0 International Licenss Purposes of the Distribution of Sample Means There are three main purposes of the DSM. 1. Estimate sample means using the empirical rule. e 68% of all sample means drawn from a population will fall between e 95% of all sample means drawn from a population will fall between * 99.7% of all sample means drawn from a population will fall between 2. Compare one sample to other samples in the same population e DSM lets us calculate how rare or common a particular sample is in that population. We do this by estimating the probability of selecting a particular sample mean from the DSM. e For example, the mean of one sample (n = 25) of IQ scores is 105. What is the probability of drawing another sample with a mean higher than 1057 3. Determine if a \"test sample\" comes from a known population A DSM allows us to decide whether it is unlikely that a particular \"test sample\" came from a particular, known population. * For example, if someone said they had a sample of 25 I1Q scores with a mean of 102, we can decide whether the sample came from our known population of 1Q scores or from another population. Variability and the Distribution of Sample Means Variability among sample means drawn from a population will always be lower than the variability among individual scores in the population. One way to remember that variability among the means of samples drawn from a population will always be lower than the variability among individual scores in that population is to think about the formula we use to calculate the standard error. o, = o/\ Because the standard error takes the standard deviation and divides it by a number greater than 1, the value of the standard error will always be smaller than the value of the standard deviation. Also, by taking the mean of all sample means, we are automatically reducing the variability between scores. Each sample mean is a summary statistic that represents the center of that sample. A sample mean \"washes out\" individual high and low scores in that sample by creating This work is licensed under a Creative Commons Attribution 4.0 International License, -. Summary - Key points When we are running inferrential statistics, we are using samples from a population and we want to make claims about that population. For instance if an advertisment agency wants to know if a new add has been effective for an international product, they likely wont measure sales in every store or online platform, instead they will probably sample from a portion of stores. If a professor wants to know the best study techinque, they use a sample of students to understand all students. Each sample is different, so how do we know what the population values are? Because of the Central limit theorum we know that: e The sample distribution will have a similar spread relative to the population it comes from, although it will always be a smaller spread than the population e Sample distributions will typically have an approximately "bell-shaped" curve e Thelarger a sample size is, the smaller the spread of the distribution, and the more normally distributed Using standard error of the mean calculation (SEM): We can approximate the average difference of the sample means around the true population mean to make inferences about the population These concepts are what allow us to use samples in inferrential statistics and be able to make claims about a population. The Assignment: 1. Try out this website to further get a visualization of what happens as you sample from a population. http:/mfviz.com/central-limit/ 2. Write a short summary of what you understood from all of this, in your own words. (It does not need to be long, just to help you conslidate this info) Submission & Rubric > Description Overview As we move forward into inferrential statistics, we typically do not have access to a whole population - instead we use samples. In module 5 you already practiced taking samples from a population of candies and seeing how the distribution of your data changed as you took more and more samples - using the applett. Most of you noticed that the more samples you took, the more your data looked like the bell- shaped curve, otherwise known as the "Standard Normal Curve!" We will learn more about the properties of sample datain this assignment. You will be focusing on the following concepts: e 1) The 4 principals of the central limit theorum e 2)Standard error of the means The main thing to keep in mind as you read through this assignment is that, when you run a statistical test, it is these principals you are learning about that allow resarchers to generalize from a sample to a population. 10 samples 50 samples 2.0 6 1.5 44 1.0 24 0.0 0 I 100 samples 1000 samples 154 125 100 4 10 4 75 4 504 54 25 0 0- Frequency M 1 z 3 2 5 6 7 B g Sample Mean (M) How could we describe the shape of this distribution of sample means? The distribution is based on sample statistics (sample means) not on individual scares. The distribution of sample means is formed by statistics obtained by selecting all possible samples of a specific size from a population Using the frequency distribution above try to answer the following questions: Whatis the probability of drawing a sample mean greater than 7 from this distribution of sample means? p(M>7)= e What is the probability of drawing a sample mean less than 4 from this distribution of sample means? p (M
Step by Step Solution
There are 3 Steps involved in it
Step: 1
Get Instant Access to Expert-Tailored Solutions
See step-by-step solutions with expert insights and AI powered tools for academic success
Step: 2
Step: 3
Ace Your Homework with AI
Get the answers you need in no time with our AI-driven, step-by-step assistance