Answered step by step
Verified Expert Solution
Question
1 Approved Answer
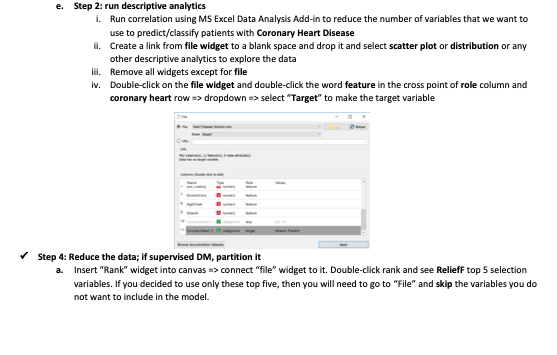
e. Step 2: run descriptive analytics i. Run correlation using MS Excel Data Analysis Add-in to reduce the number of variables that we want to
 e. Step 2: run descriptive analytics i. Run correlation using MS Excel Data Analysis Add-in to reduce the number of variables that we want to use to predict/classify patients with Coronary Heart Disease ii. Create a link from file widget to a blank space and drop it and select scatter plot or distribution or any other descriptive analytics to explore the data iii. Remove all widgets except for file iv. Double-click on the file widget and double-click the word feature in the cross point of role column and coronary heart row dropdown select "Target" to make the target variable Step 4: Reduce the data; if supervised DM, partition it a. Insert "Rank" widget into canvas => connect "file" widget to it. Double-click rank and see ReliefF top 5 selection variables. If you decided to use only these top five, then you will need to go to "File" and skip the variables you do not want to include in the model
 Step by Step Solution
There are 3 Steps involved in it
Step: 1

Get Instant Access to Expert-Tailored Solutions
See step-by-step solutions with expert insights and AI powered tools for academic success
Step: 2

Step: 3

Ace Your Homework with AI
Get the answers you need in no time with our AI-driven, step-by-step assistance
Get Started


