

Answered step by step
Verified Expert Solution
Question
1 Approved Answer
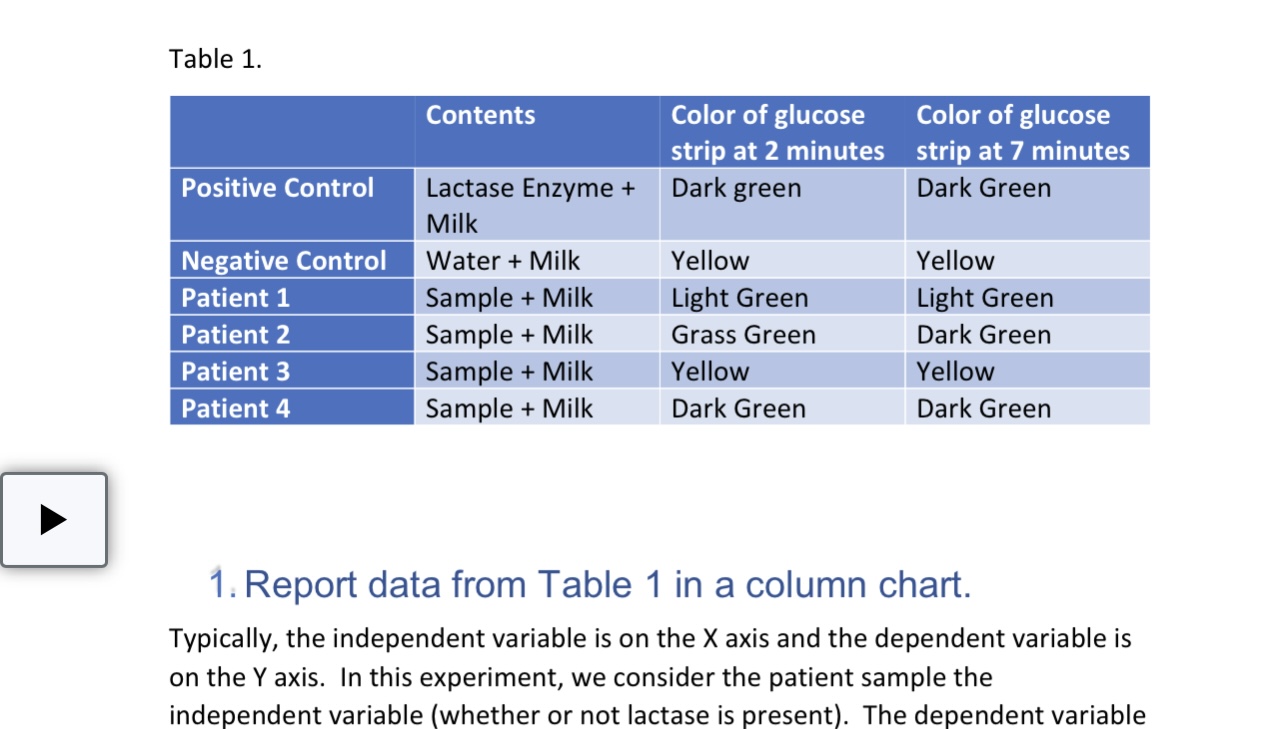
E Table 1. Contents Color of glucose Color of glucose strip at 2 minutes strip at 7 minutes Lactase Enzyme + Dark green Dark Green

Step by Step Solution
There are 3 Steps involved in it
Step: 1

Get Instant Access to Expert-Tailored Solutions
See step-by-step solutions with expert insights and AI powered tools for academic success
Step: 2

Step: 3
Ace Your Homework with AI
Get the answers you need in no time with our AI-driven, step-by-step assistance
Get Started
Calculus Early Transcendentals
Authors: Howard Anton, Irl C Bivens, Stephen Davis
11th Edition
1118883764, 9781118883761