

Answered step by step
Verified Expert Solution
Question
1 Approved Answer
e. Take the variables from #2d that have a significant correlation with Overall Satisfaction and use Excels Data Analysis tool to run a Regression Analysis
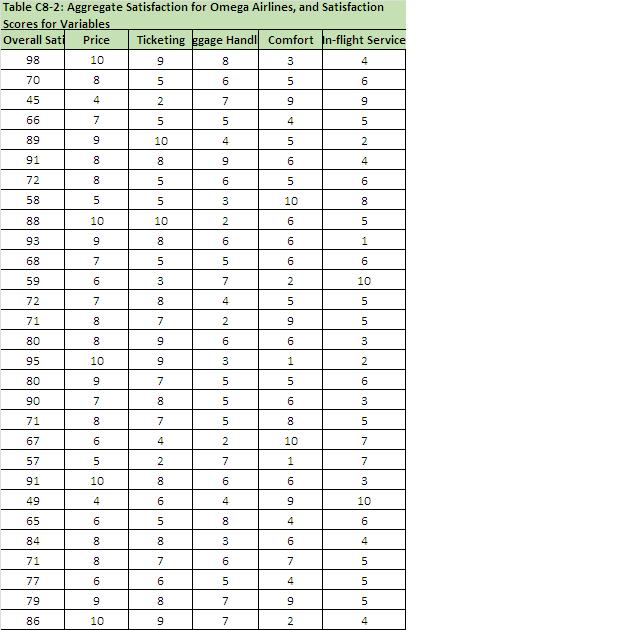 e. Take the variables from #2d that have a significant correlation with Overall Satisfaction and use Excels Data Analysis tool to run a Regression Analysis at 95% confidence. Make sure to show your line-fit plots and labels for each variable. e. Take the variables from #2d that have a significant correlation with Overall Satisfaction and use Excels Data Analysis tool to run a Regression Analysis at 95% confidence. Make sure to show your line-fit plots and labels for each variable. |
| Overall Satisfaction | Price | Ticketing | Baggage Handling | Comfort | In-flight Service | |
| Overall Satisfaction | 1.000000 | |||||
| Price | 0.870815 | 1.000000 | ||||
| Ticketing | 0.840143 | 0.791073 | 1.000000 | |||
| Baggage Handling | 0.024489 | 0.003292 | -0.172141 | 1.000000 | ||
| Comfort | -0.315245 | -0.291548 | -0.070663 | -0.356319 | 1.000000 | |
| In-flight Service | -0.879247 | -0.756867 | -0.769555 | 0.020072 | 0.248935 | 1 |
Step by Step Solution
There are 3 Steps involved in it
Step: 1

Get Instant Access to Expert-Tailored Solutions
See step-by-step solutions with expert insights and AI powered tools for academic success
Step: 2

Step: 3
Ace Your Homework with AI
Get the answers you need in no time with our AI-driven, step-by-step assistance
Get Started
Be Audit You Can Be
Authors: Awesome Auditor
1st Edition
1659095700, 978-1659095708