

Answered step by step
Verified Expert Solution
Question
1 Approved Answer
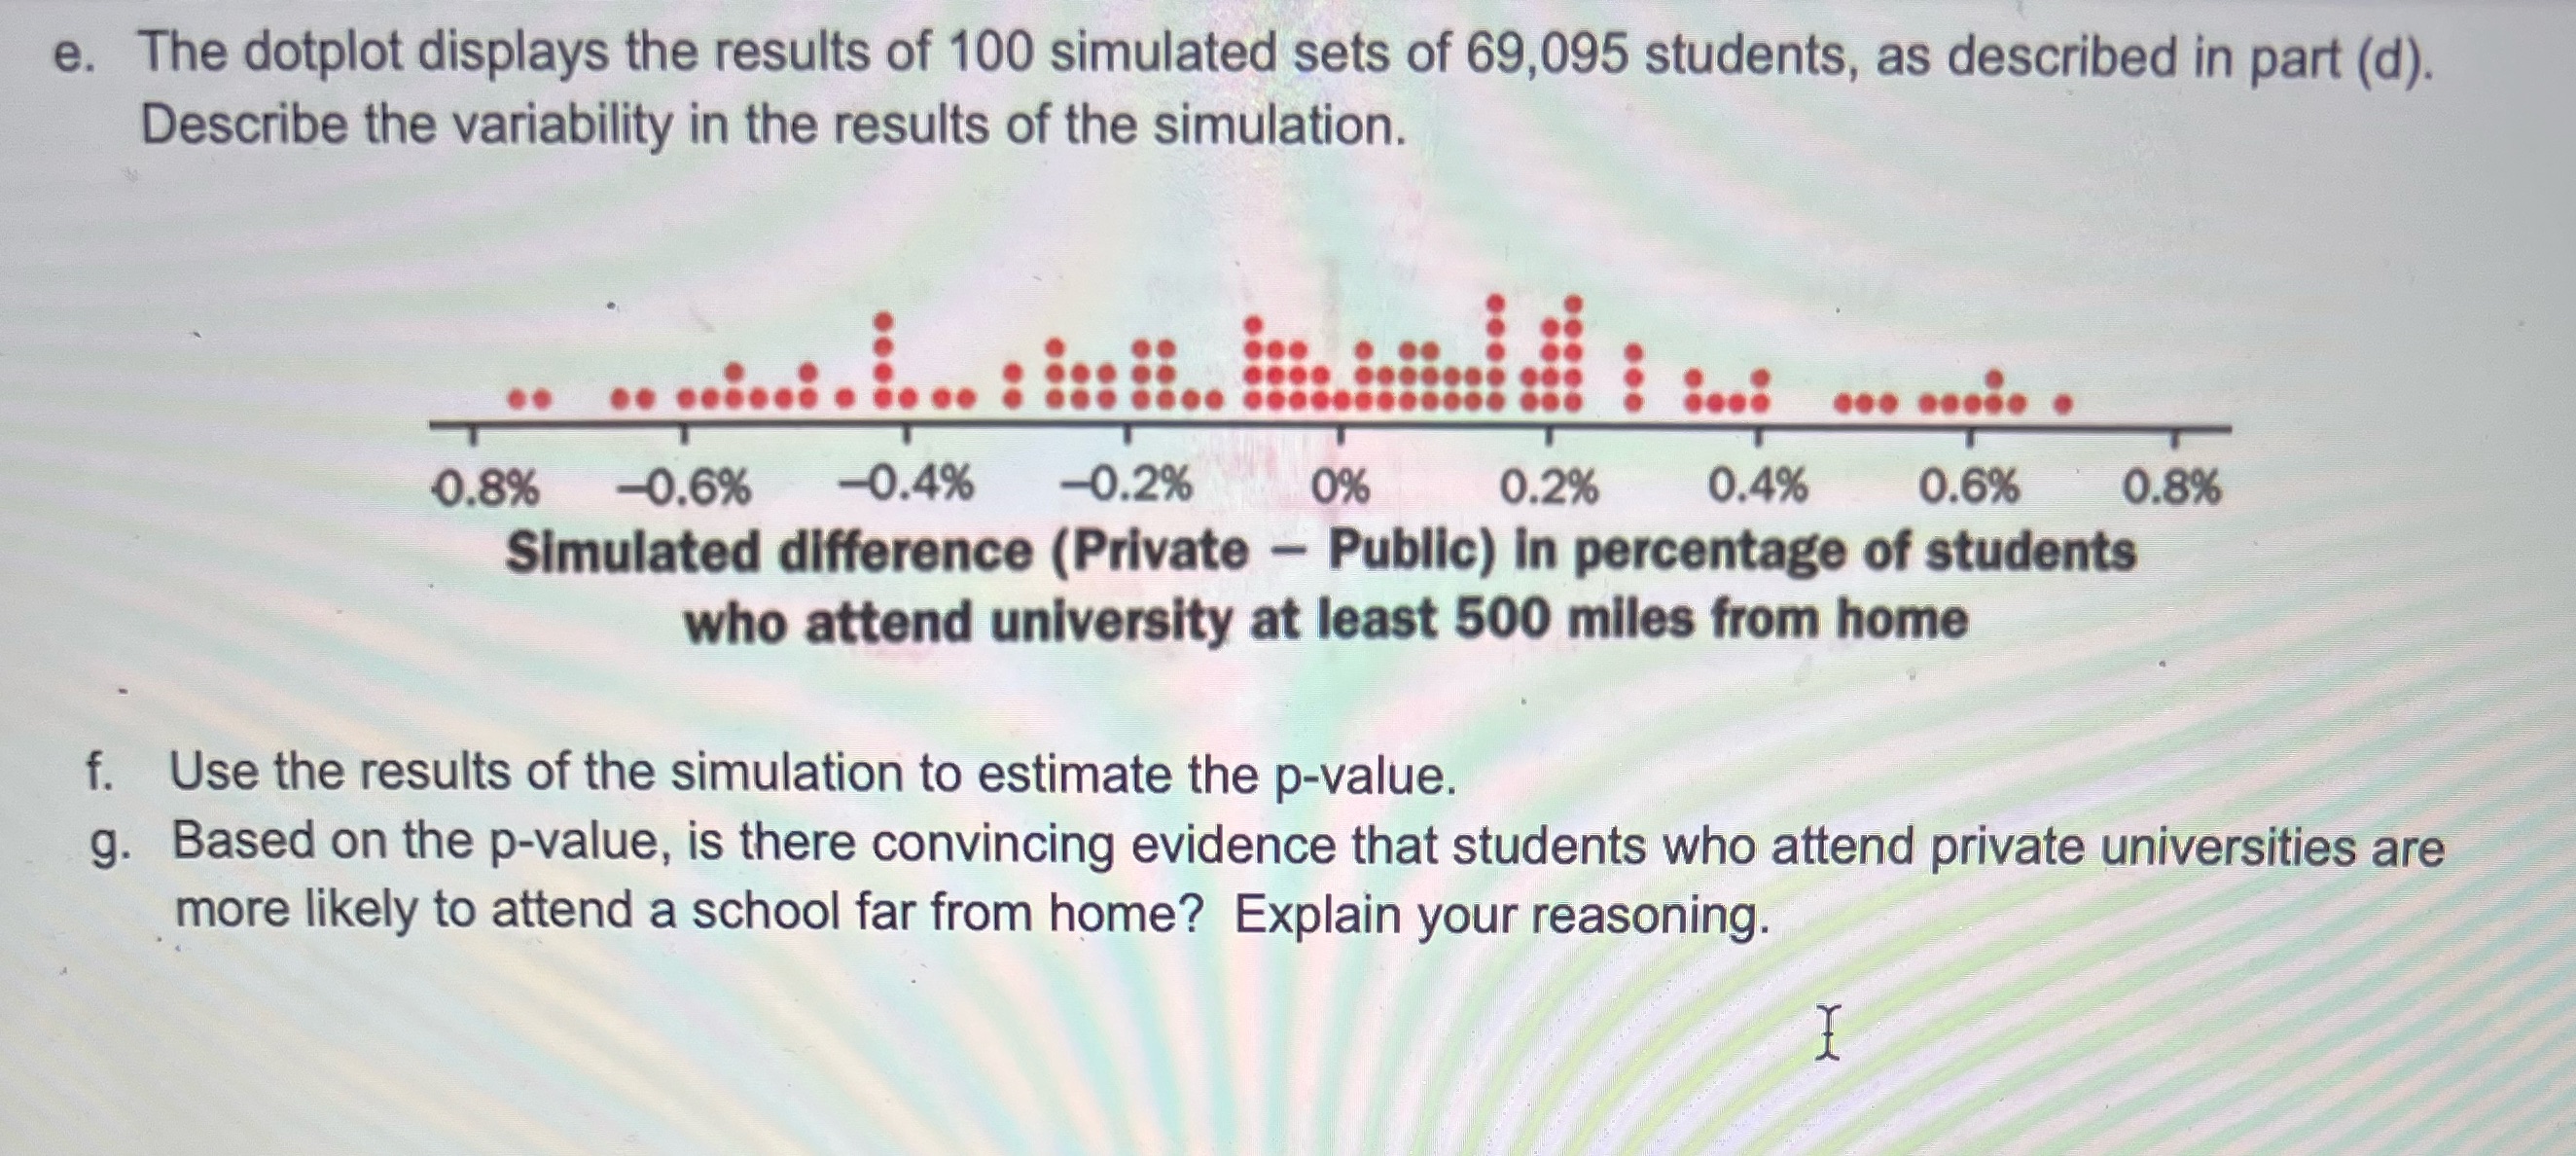
e. The dotplot displays the results of 100 simulated sets of 69,095 students, as described in part (d). Describe the variability in the results of
Step by Step Solution
There are 3 Steps involved in it
Step: 1

Get Instant Access to Expert-Tailored Solutions
See step-by-step solutions with expert insights and AI powered tools for academic success
Step: 2

Step: 3
Ace Your Homework with AI
Get the answers you need in no time with our AI-driven, step-by-step assistance
Get Started
Trigonometry A Unit Circle Approach
Authors: Michael Sullivan
10th Edition
0321999347, 9780321999344