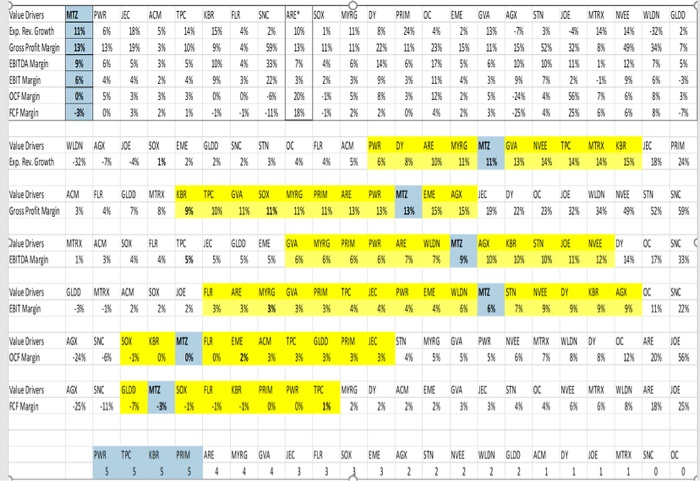
E Value Drivers Eip. Rer Growth Gross Proft Margin EBITDA Margin EBIT Marin OCS Margin FCF Margin MTZ PREC 19% 6% 18% 13% 3% 19% 9% 6% 5% ACM 5% 3% 3% TCBRFUR 14% 15% 4% 10% 9% 4% 5% 11% 4% SNC 2% 58% 33% RESOX 10% 1% 13% 11% 7% 4% VIRG DY 11% 8% 11% 22% 6% 14% PRIM 24% 11% 6% OCEME 4% 2% 23% 15% 1% 5% GVA 13% 11% 6% AGX -7% 15% 13% STN 3% 52% 10% % 32% 11% NTRX MEE WIDN GUDD 14% 14% -32% 2% 8% 9 34% 7% 1% 12% 7% 5% 5% 0% 3% 3% 3% 2% 3% 1% 0% -1% 0% -1% -6% -11% 20% 18% 1% -1% 5% 2% 8% 2% 3% 0% 12% 1% 2% 2% 5% 3% -24% -25% 4% 4% 56% 25% 7% 5% 6% 6% 3% 8% 3% -7% X Value Drivers Exp. Rar. Growth WIDNAGU JE 32% -7% 4% SOX 1% EVE 2% GUDD 2% SNCSTNO 2% 3% FLRAM 4% 5% PWR 6% DY 8% ARE 99% MAG MTZ 11% 11% GIA 13% NVEETC 14% 14% TRX 14% KBR 15% JEC 18% PRIM 24% 4% Value Drivers Gross Proft Margin ACM 3% FLR 4% GLDO MRX 7% 8% BRTCGVA % 10% 11% SOX 11% MYRG PRIMARE 11% 11% 13% PWR MZ ENEAGX 13% 3% 15% 15% ECDY 19% 22% OCIOEWLON NEE STN 23% 22% 34% 19% 52% SNC 59% Dalue Drivers EBITDA Margin MTRX ACM 1% 3% SOK 4% FLRTPC 4% 5% ECGLDO EME GA 5% 5% 5% 6% MYG PRIM 6% 6% PWR 6% ARE 7% WLDN M 7% AGUKBRST 9% 10% 10% 10% JOE 11% NEEDY 12% 14% OC 17% SNC 33% Value Drivers EBIT Margin GLDO MTRKAM SOX O -3% -3% 2% 2% FERARE 3% 3% MIRG GA 3% 3% PRIM 3% TCEC PREMEWLDN MTZ 4% 4% 4% 4% 5% 6% STN 7% NVEEDY 9% 9% KRAG 9% 9% OC 11% SNC 22% 2% Value Drivers OCH Margin AX 34% SNC 6% SOKKRMTZ 1% 0% 0% FLRENE 0% 2% ACM 3% TEC 3% GIDO PRIMEC 3% 3% 3% STN 4% MYAG GA 5% 5% PWRNVEE MTRX WLDN DY 5% 6% 7% 8% 8% OCARE 12% 20% DOE 56% Value Drivers FCF Margit AX 25% SNC -11% GUDO MTZ -% -3% SOK -1% FUR -1% KBR -1% PRIM PWRTFC 0% 0% 1% MIG DYANEVE GA JECSTNOC 2% 2% 2% 2% 3% 3% 4% 4% NEEMTRX WLDN ARE 6% 6% 8% 18% JOE 28% PWRTPCBR PRIMARE MYRG GAEC FIRSOX EMEAX STN NEE WLN GLDO ACM DYJEMTEX SNC OC b. Given the chart on the previous page, do you think you have a good comp set for Mastec? Explain your logic. c. Briefly explain the difference between direct valuation and indirect valuation. Which method do you think is more appropriate here given that some firms in this industry rely very heavily on debt financing while others do not? Briefly, why? E Value Drivers Eip. Rer Growth Gross Proft Margin EBITDA Margin EBIT Marin OCS Margin FCF Margin MTZ PREC 19% 6% 18% 13% 3% 19% 9% 6% 5% ACM 5% 3% 3% TCBRFUR 14% 15% 4% 10% 9% 4% 5% 11% 4% SNC 2% 58% 33% RESOX 10% 1% 13% 11% 7% 4% VIRG DY 11% 8% 11% 22% 6% 14% PRIM 24% 11% 6% OCEME 4% 2% 23% 15% 1% 5% GVA 13% 11% 6% AGX -7% 15% 13% STN 3% 52% 10% % 32% 11% NTRX MEE WIDN GUDD 14% 14% -32% 2% 8% 9 34% 7% 1% 12% 7% 5% 5% 0% 3% 3% 3% 2% 3% 1% 0% -1% 0% -1% -6% -11% 20% 18% 1% -1% 5% 2% 8% 2% 3% 0% 12% 1% 2% 2% 5% 3% -24% -25% 4% 4% 56% 25% 7% 5% 6% 6% 3% 8% 3% -7% X Value Drivers Exp. Rar. Growth WIDNAGU JE 32% -7% 4% SOX 1% EVE 2% GUDD 2% SNCSTNO 2% 3% FLRAM 4% 5% PWR 6% DY 8% ARE 99% MAG MTZ 11% 11% GIA 13% NVEETC 14% 14% TRX 14% KBR 15% JEC 18% PRIM 24% 4% Value Drivers Gross Proft Margin ACM 3% FLR 4% GLDO MRX 7% 8% BRTCGVA % 10% 11% SOX 11% MYRG PRIMARE 11% 11% 13% PWR MZ ENEAGX 13% 3% 15% 15% ECDY 19% 22% OCIOEWLON NEE STN 23% 22% 34% 19% 52% SNC 59% Dalue Drivers EBITDA Margin MTRX ACM 1% 3% SOK 4% FLRTPC 4% 5% ECGLDO EME GA 5% 5% 5% 6% MYG PRIM 6% 6% PWR 6% ARE 7% WLDN M 7% AGUKBRST 9% 10% 10% 10% JOE 11% NEEDY 12% 14% OC 17% SNC 33% Value Drivers EBIT Margin GLDO MTRKAM SOX O -3% -3% 2% 2% FERARE 3% 3% MIRG GA 3% 3% PRIM 3% TCEC PREMEWLDN MTZ 4% 4% 4% 4% 5% 6% STN 7% NVEEDY 9% 9% KRAG 9% 9% OC 11% SNC 22% 2% Value Drivers OCH Margin AX 34% SNC 6% SOKKRMTZ 1% 0% 0% FLRENE 0% 2% ACM 3% TEC 3% GIDO PRIMEC 3% 3% 3% STN 4% MYAG GA 5% 5% PWRNVEE MTRX WLDN DY 5% 6% 7% 8% 8% OCARE 12% 20% DOE 56% Value Drivers FCF Margit AX 25% SNC -11% GUDO MTZ -% -3% SOK -1% FUR -1% KBR -1% PRIM PWRTFC 0% 0% 1% MIG DYANEVE GA JECSTNOC 2% 2% 2% 2% 3% 3% 4% 4% NEEMTRX WLDN ARE 6% 6% 8% 18% JOE 28% PWRTPCBR PRIMARE MYRG GAEC FIRSOX EMEAX STN NEE WLN GLDO ACM DYJEMTEX SNC OC b. Given the chart on the previous page, do you think you have a good comp set for Mastec? Explain your logic. c. Briefly explain the difference between direct valuation and indirect valuation. Which method do you think is more appropriate here given that some firms in this industry rely very heavily on debt financing while others do not? Briefly, why


