

Answered step by step
Verified Expert Solution
Question
1 Approved Answer
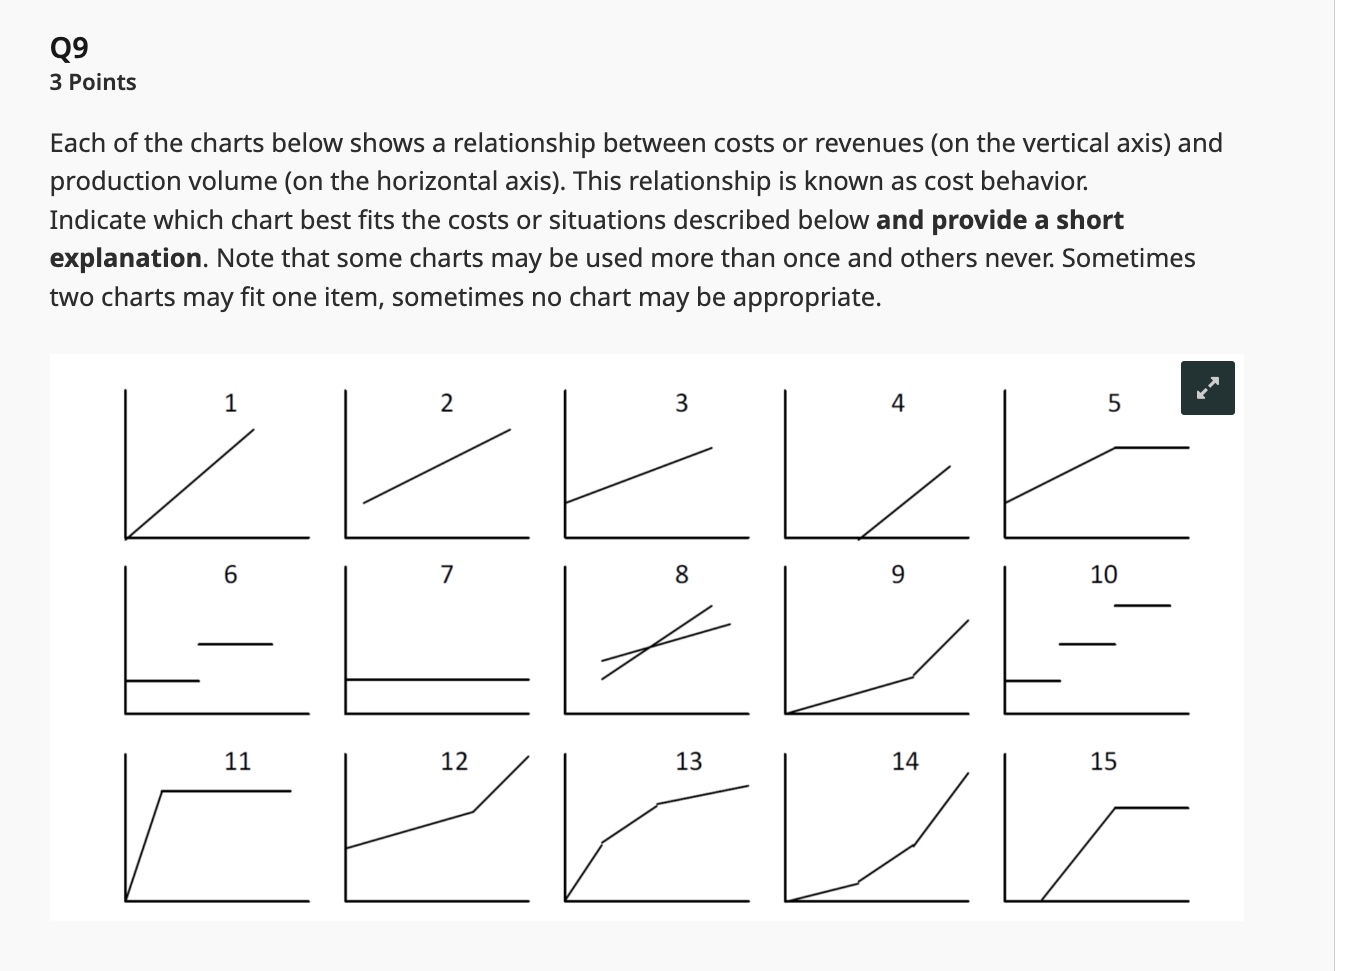
Each of the charts below shows a relationship between costs or revenues ( on the vertical axis ) and production volume ( on the horizontal
Each of the charts below shows a relationship between costs or revenues on the vertical axis and
production volume on the horizontal axis This relationship is known as cost behavior.
Indicate which chart best fits the costs or situations described below and provide a short
explanation. Note that some charts may be used more than once and others never. Sometimes
two charts may fit one item, sometimes no chart may be appropriate.
Q
Direct material costs
Chart number:
Explanation:
Q
Supervisors salary
Chart number:
Explanation:
Q
Electricity costs for a bread packing machine in a bakery
Chart number:
Explanation:
Q
Cost of raw materials charged at $ per unit for the first units, $ per unit for the next units, and $ per unit for any additional units
Chart number:
Explanation:
Q
Electricity costs for a bakery based on a fixed annual charge plus a charge for every kWh kilowatt hour used
Chart number:
Explanation:
Q
Cost of a data transmission service that charges for the first minutes of use at a constant rate per minute and is free for any additional minutes of transmission time
Chart number:
Explanation:
Step by Step Solution
There are 3 Steps involved in it
Step: 1

Get Instant Access to Expert-Tailored Solutions
See step-by-step solutions with expert insights and AI powered tools for academic success
Step: 2

Step: 3
Ace Your Homework with AI
Get the answers you need in no time with our AI-driven, step-by-step assistance
Get Started
Accounting Principles
Authors: Jerry J. Weygandt, Paul D. Kimmel, Donald E. Kieso
10th Edition
1119491630, 978-1119491637, 978-0470534793