Question
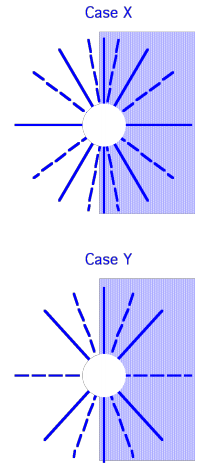
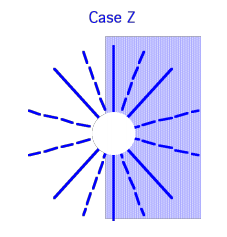
Each of the diagrams at right shows all the nodal lines (dashed) and all the lines of maximum constructive interference (solid) due to two point
Each of the diagrams at right shows all the nodal lines (dashed) and all
the lines of maximum constructive interference (solid) due to two
point sources. The wavelength, %u03BB, is the same in all three cases; the
source separation is different. The sources, which are not shown, lie
along a horizontal line.
a. Label each nodal line and line of maximum constructive
interference in the shaded region with the appropriate value of %u2206r
(in terms of %u03BB). (%u2206r is the difference in distances to the sources.)
b. For each case, determine the source separation (in terms of %u03BB).
For any case(s) for which it is not possible to determine the source
separation exactly, determine the source separation as closely as
you can, i.e., give the smallest range into which the source
separation must fall.
c. Explain how you determined the source separations.


Case X Case Y Case X Case Y
Step by Step Solution
3.43 Rating (159 Votes )
There are 3 Steps involved in it
Step: 1
The diagram below depicts an interference pattern produced by two periodic disturbances The crests a...
Get Instant Access to Expert-Tailored Solutions
See step-by-step solutions with expert insights and AI powered tools for academic success
Step: 2

Step: 3

Ace Your Homework with AI
Get the answers you need in no time with our AI-driven, step-by-step assistance
Get Started


