

Question
Each of these Graphs were constructed from a series of continuous Data, X (horizontal Axis), a series of discrete binary (dummy) data, D and a
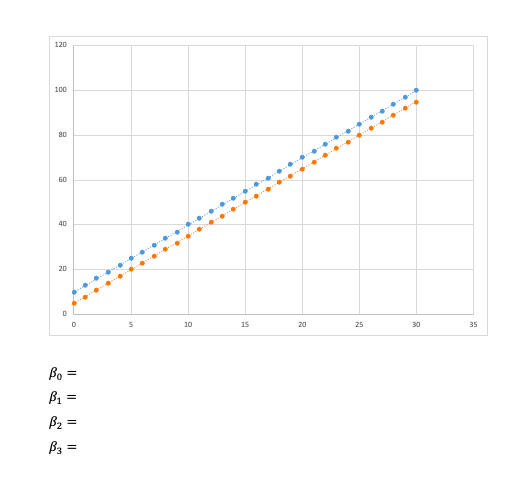
Each of these Graphs were constructed from a series of continuous Data, X (horizontal Axis), a series of discrete binary (dummy) data, D and a continuous dependent variable, Y (vertical axis). The regression model is as follows
y=?_0+?_1 X+?_2 D+?_3 (X*D)+u
The Orange Line is the expectation when D= 0 given X, and the blue line is expectation when D = 1 given X.Find each coefficient for the following graphs.
Step by Step Solution
There are 3 Steps involved in it
Step: 1

Get Instant Access to Expert-Tailored Solutions
See step-by-step solutions with expert insights and AI powered tools for academic success
Step: 2

Step: 3
Ace Your Homework with AI
Get the answers you need in no time with our AI-driven, step-by-step assistance
Get Started
Non-Cooperative Game Theory
Authors: Takako Fujiwara Greve
1st Edition
4431556451, 9784431556459