Each question refers to the same initial data. Treat each Part individually (unless otherwise specified). Ignore income taxes. Assume no beginning or ending inventories. Unless stated otherwise, all calculations and income statements should be based on a one-month period. Calculations and backup should be completed and submitted in Excel. Use proper Contribution Income Statement formatting example below. Analysis can either be typed into cells in Excel (formatted to be easily legible) or typed into a text box in Excel. One Excel file is to be submitted for this case study. No additional files (Word documents or otherwise) will be accepted or graded. This case study is worth 100 points total.
Contribution Margin Format Example:
 Data for all questions:
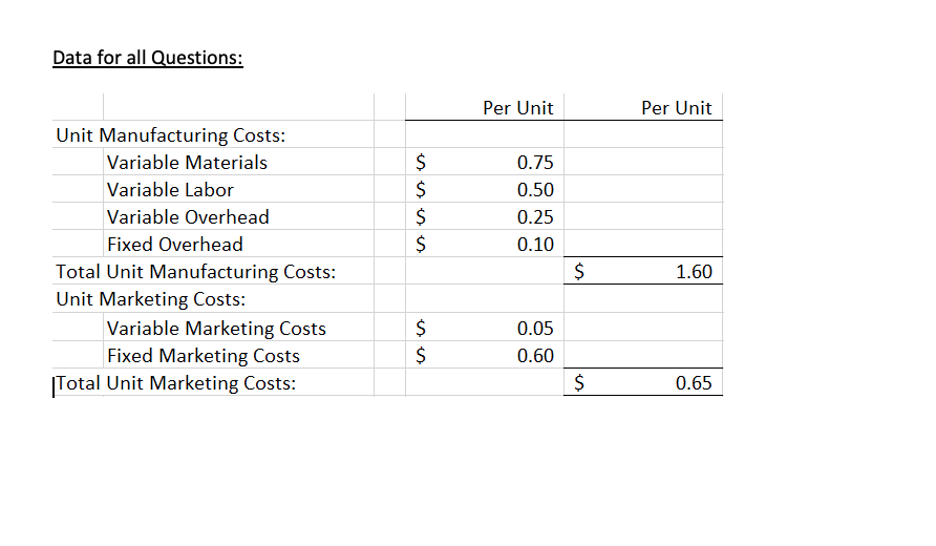 Choco produces chocolate breakfast cereal. Their cereal is sold at many grocery stores across the country. The cost of manufacturing and marketing their cereal, at their normal factory volume of 25,000 boxes per month, is shown in the table below. Choco sells their cereal for $3 per box. Choco produces their cereal in the month it is sold, and will not produce more if they do not have the customer orders (demand) for them. Choco is making a small profit, but they would prefer to increase their Operating Income.
Hint: Fixed costs are shown on a per-unit basis in the table based on normal volume. However, fixed costs as a total do not change when volume changes, so you will need to determine total fixed costs first.
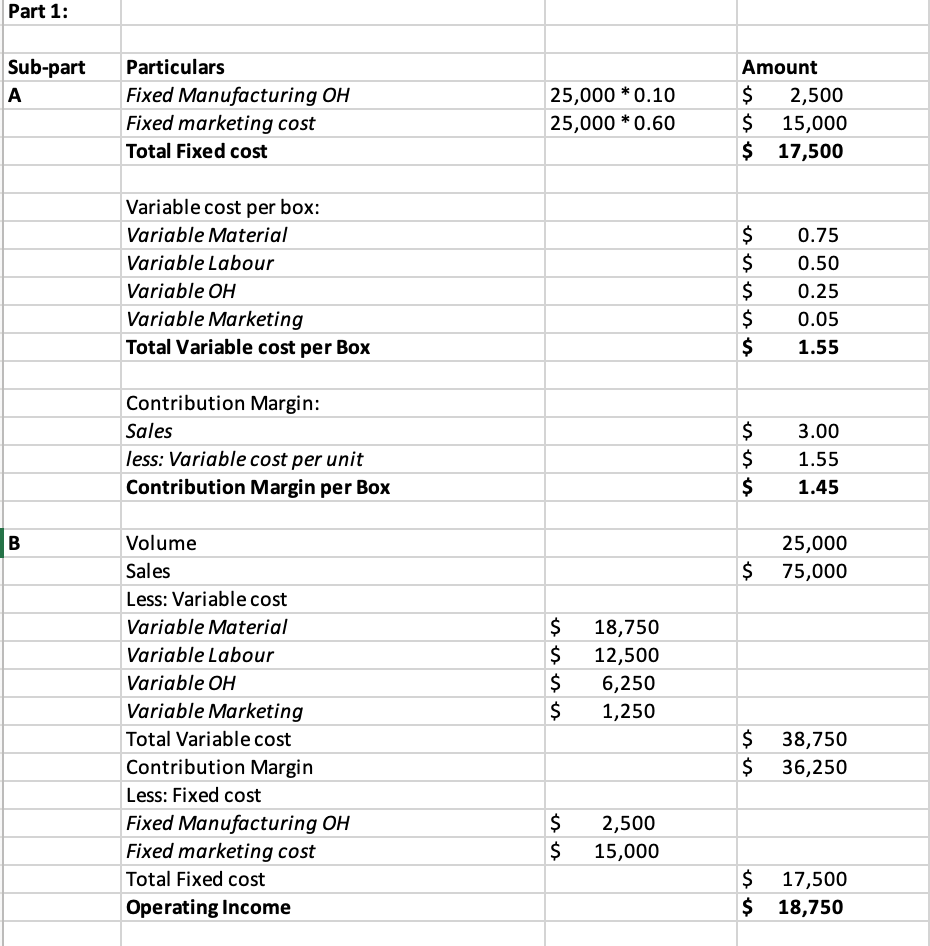
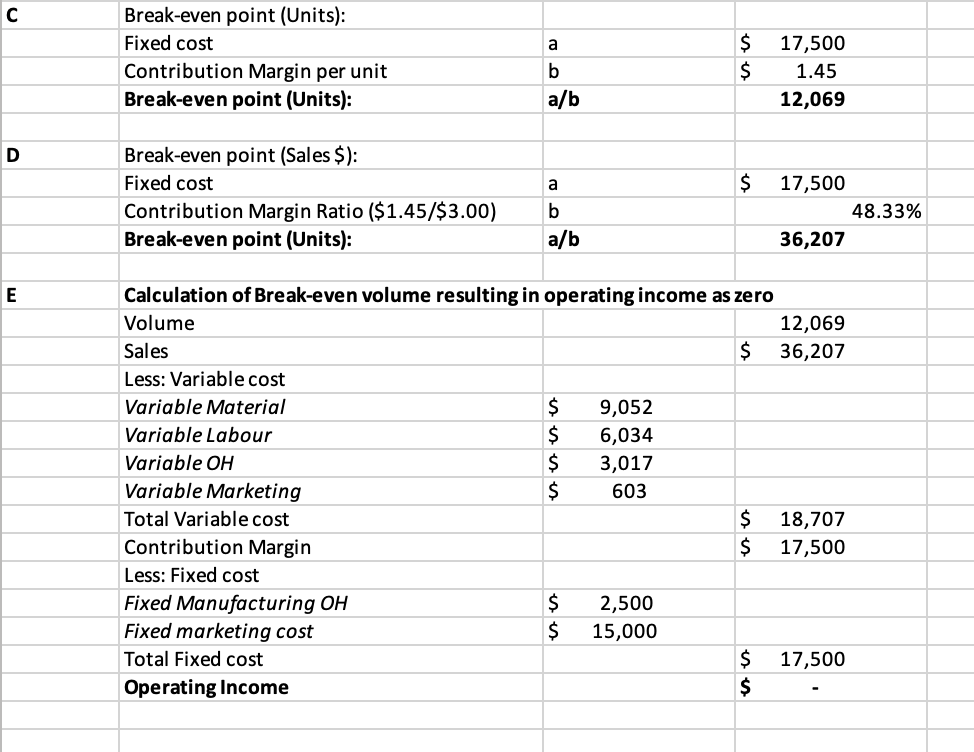
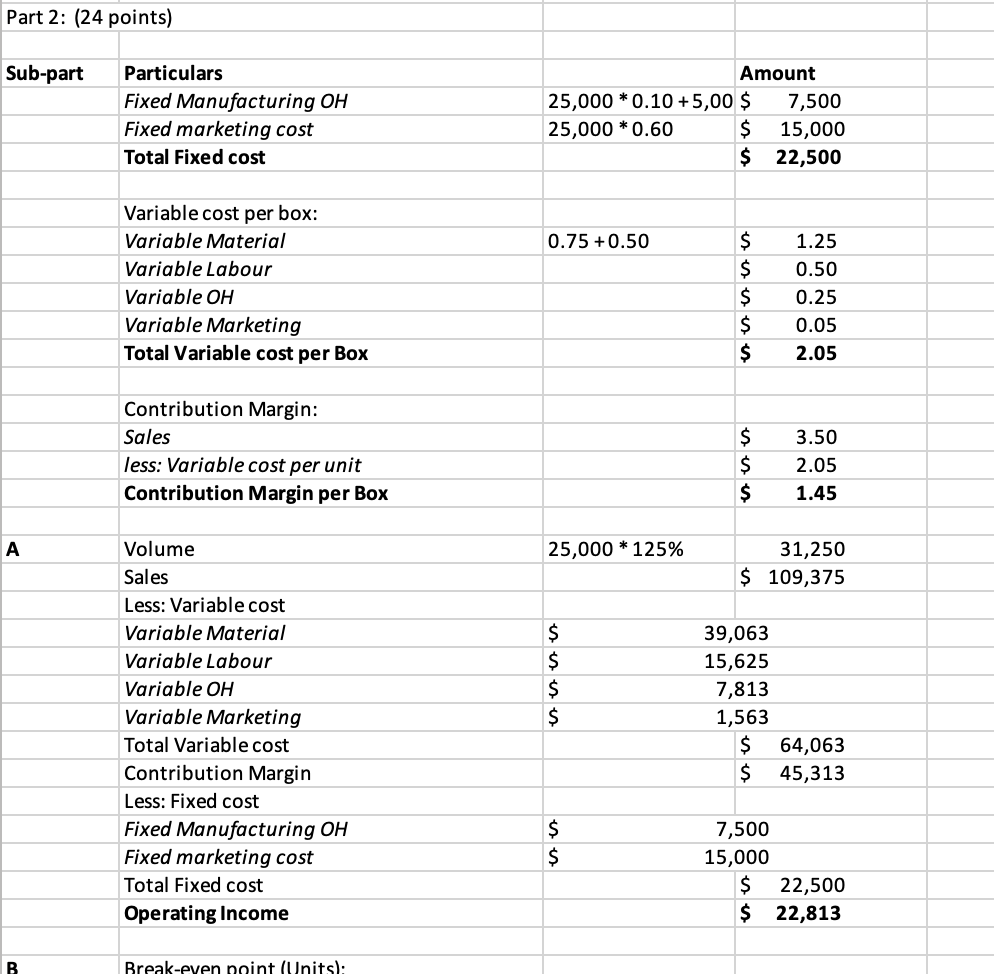
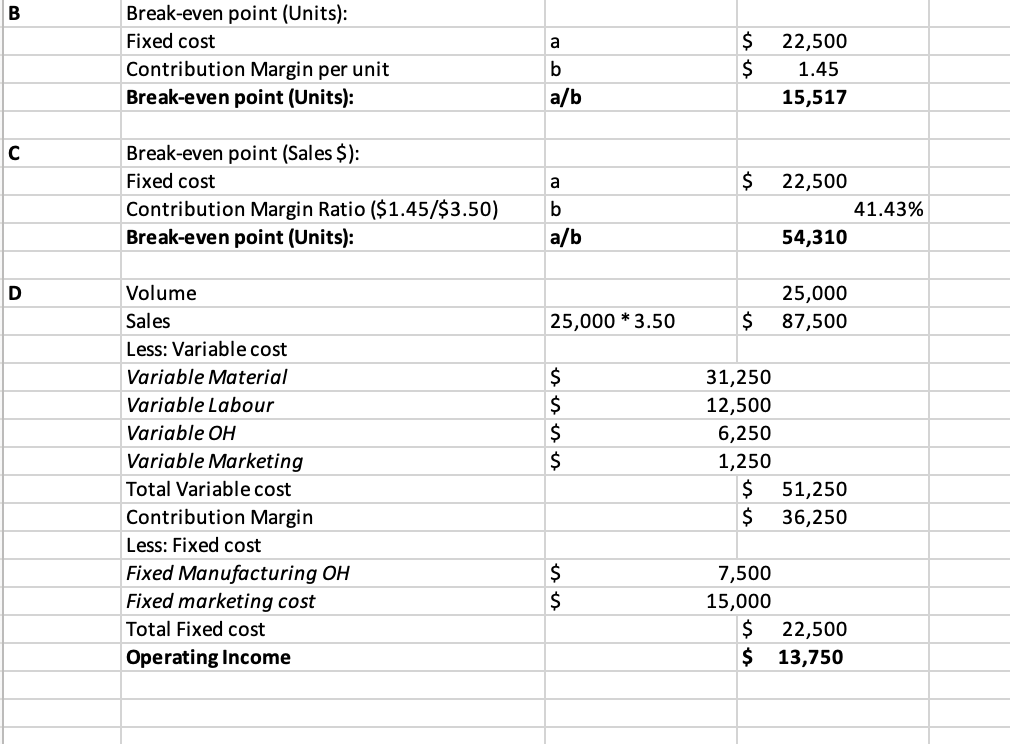
Here are the first two parts completed! Please let me know if you see any issues with them I'd appreciate it!
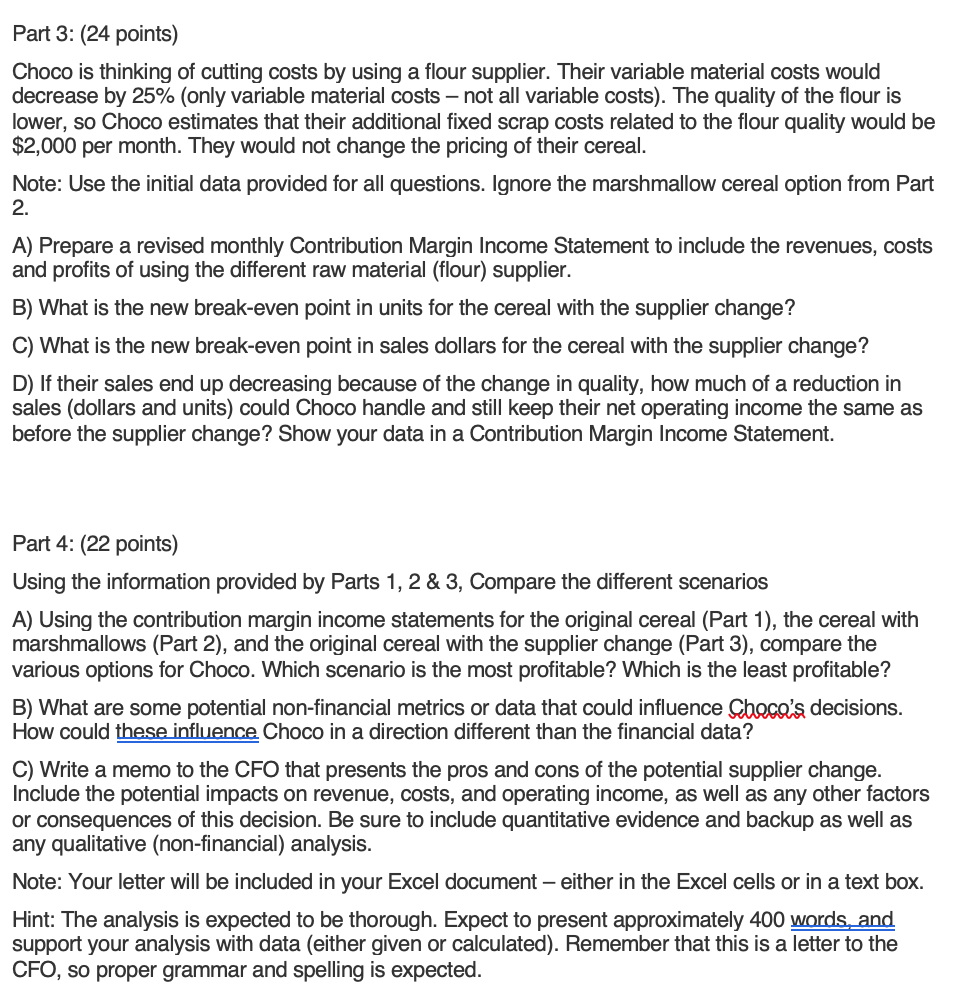 I need some help with Part 3, any assistance is appreciated, thanks!
XX Contribution Margin Format Example: Volume Sales XX Variable costs (listed) XX Variable Costs Total XX Contribution Margin XX Fixed Costs (listed) XX Fixed Costs Total XX Operating Income XX Data for all Questions: Per Unit Per Unit $ $ $ $ 0.75 0.50 0.25 0.10 Unit Manufacturing Costs: Variable Materials Variable Labor Variable Overhead Fixed Overhead Total Unit Manufacturing Costs: Unit Marketing Costs: Variable Marketing Costs Fixed Marketing Costs Total Unit Marketing Costs: $ 1.60 $ $ 0.05 0.60 $ 0.65 Part 1: Sub-part A Particulars Fixed Manufacturing OH Fixed marketing cost Total Fixed cost 25,000 * 0.10 25,000 * 0.60 Amount $ 2,500 $ 15,000 $ 17,500 Variable cost per box: Variable Material Variable Labour Variable OH Variable Marketing Total Variable cost per Box $ $ $ $ $ 0.75 0.50 0.25 0.05 1.55 Contribution Margin: Sales less: Variable cost per unit Contribution Margin per Box $ $ $ 3.00 1.55 1.45 B 25,000 $ 75,000 $ $ $ $ 18,750 12,500 6,250 1,250 Volume Sales Less: Variable cost Variable Material Variable Labour Variable OH Variable Marketing Total Variable cost Contribution Margin Less: Fixed cost Fixed Manufacturing OH Fixed marketing cost Total Fixed cost Operating Income $ 38,750 $ 36,250 $ $ 2,500 15,000 $ 17,500 $ 18,750 a Break-even point (Units): Fixed cost Contribution Margin per unit Break-even point (Units): $ $ b a/b 17,500 1.45 12,069 D a $ Break-even point (Sales $): Fixed cost Contribution Margin Ratio ($1.45/$3.00) Break-even point (Units): b 17,500 48.33% 36,207 a/b E Calculation of Break-even volume resulting in operating income as zero Volume 12,069 Sales $ 36,207 Less: Variable cost Variable Material $ 9,052 Variable Labour $ 6,034 Variable OH $ 3,017 Variable Marketing $ 603 Total Variable cost $ 18,707 Contribution Margin $ 17,500 Less: Fixed cost Fixed Manufacturing OH $ 2,500 Fixed marketing cost $ 15,000 Total Fixed cost $ 17,500 Operating Income $ Part 2: (24 points) Sub-part Particulars Fixed Manufacturing OH Fixed marketing cost Total Fixed cost Amount 25,000 * 0.10 +5,00 $ 7,500 25,000 * 0.60 $ 15,000 $ 22,500 0.75 +0.50 Variable cost per box: Variable Material Variable Labour Variable OH Variable Marketing Total Variable cost per Box $ $ $ $ $ 1.25 0.50 0.25 0.05 2.05 Contribution Margin: Sales less: Variable cost per unit Contribution Margin per Box $ $ $ 3.50 2.05 1.45 25,000 * 125% 31,250 $ 109,375 $ $ $ $ Volume Sales Less: Variable cost Variable Material Variable Labour Variable OH Variable Marketing Total Variable cost Contribution Margin Less: Fixed cost Fixed Manufacturing OH Fixed marketing cost Total Fixed cost Operating Income 39,063 15,625 7,813 1,563 $ 64,063 $ 45,313 $ $ 7,500 15,000 $ 22,500 $ 22,813 B Break-even point (Units): B a Break-even point (Units): Fixed cost Contribution Margin per unit Break-even point (Units): $ $ b a/b 22,500 1.45 15,517 a $ Break-even point (Sales $): Fixed cost Contribution Margin Ratio ($1.45/$3.50) Break-even point (Units): b a/b 22,500 41.43% 54,310 D 25,000 87,500 25,000 * 3.50 $ $ $ $ $ Volume Sales Less: Variable cost Variable Material Variable Labour Variable OH Variable Marketing Total Variable cost Contribution Margin Less: Fixed cost Fixed Manufacturing OH Fixed marketing cost Total Fixed cost Operating Income 31,250 12,500 6,250 1,250 $ 51,250 $ 36,250 $ $ 7,500 15,000 $ 22,500 $ 13,750 Part 3: (24 points) Choco is thinking of cutting costs by using a flour supplier. Their variable material costs would decrease by 25% (only variable material costs - not all variable costs). The quality of the flour is lower, so Choco estimates that their additional fixed scrap costs related to the flour quality would be $2,000 per month. They would not change the pricing of their cereal. Note: Use the initial data provided for all questions. Ignore the marshmallow cereal option from Part 2. A) Prepare a revised monthly Contribution Margin Income Statement to include the revenues, costs and profits of using the different raw material (flour) supplier. B) What is the new break-even point in units for the cereal with the supplier change? C) What is the new break-even point in sales dollars for the cereal with the supplier change? D) If their sales end up decreasing because of the change in quality, how much of a reduction in sales (dollars and units) could Choco handle and still keep their net operating income the same as before the supplier change? Show your data in a Contribution Margin Income Statement. Part 4: (22 points) Using the information provided by Parts 1, 2 & 3, Compare the different scenarios A) Using the contribution margin income statements for the original cereal (Part 1), the cereal with marshmallows (Part 2), and the original cereal with the supplier change (Part 3), compare the various options for Choco. Which scenario is the most profitable? Which is the least profitable? B) What are some potential non-financial metrics or data that could influence Cbece's decisions. How could these influence Choco in a direction different than the financial data? C) Write a memo to the CFO that presents the pros and cons of the potential supplier change. Include the potential impacts on revenue, costs, and operating income, as well as any other factors or consequences of this decision. Be sure to include quantitative evidence and backup as well as any qualitative (non-financial analysis. Note: Your letter will be included in your Excel document - either in the Excel cells or in a text box. Hint: The analysis is expected to be thorough. Expect to present approximately 400 words, and support your analysis with data (either given or calculated). Remember that this is a letter to the CFO, so proper grammar and spelling is expected
 Data for all questions:
  Choco produces chocolate breakfast cereal. Their cereal is sold at many grocery stores across the country. The cost of manufacturing and marketing their cereal, at their normal factory volume of 25,000 boxes per month, is shown in the table below. Choco sells their cereal for $3 per box. Choco produces their cereal in the month it is sold, and will not produce more if they do not have the customer orders (demand) for them. Choco is making a small profit, but they would prefer to increase their Operating Income.


 I need some help with Part 3, any assistance is appreciated, thanks!


