Question
Each table in the accompanying LineFit data contains a set of data that describes a functional relationship between the dependent variable y and the independent
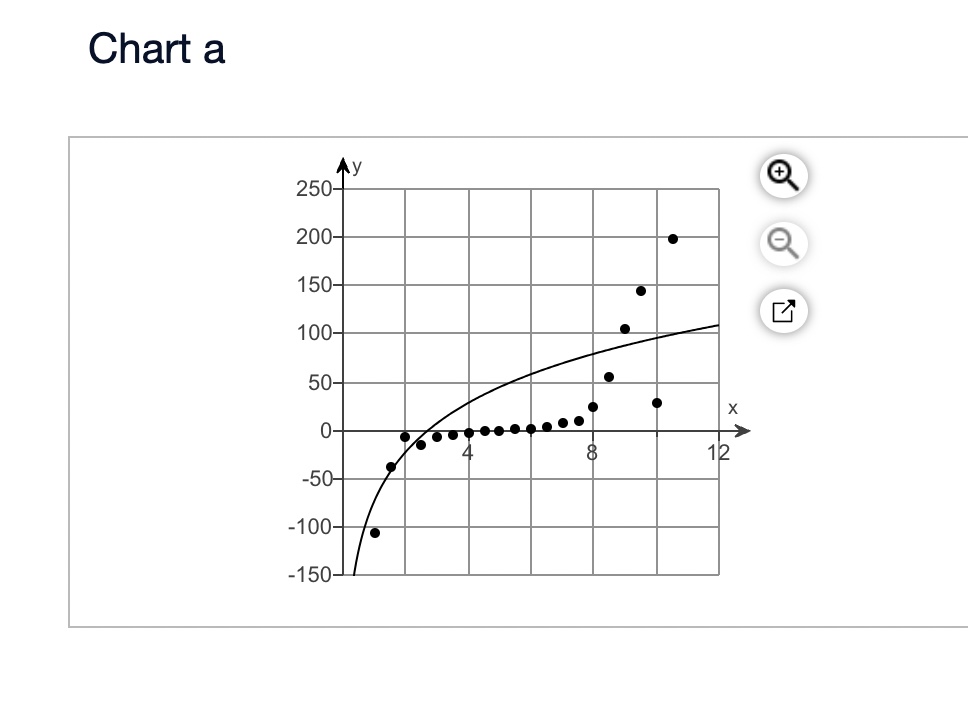
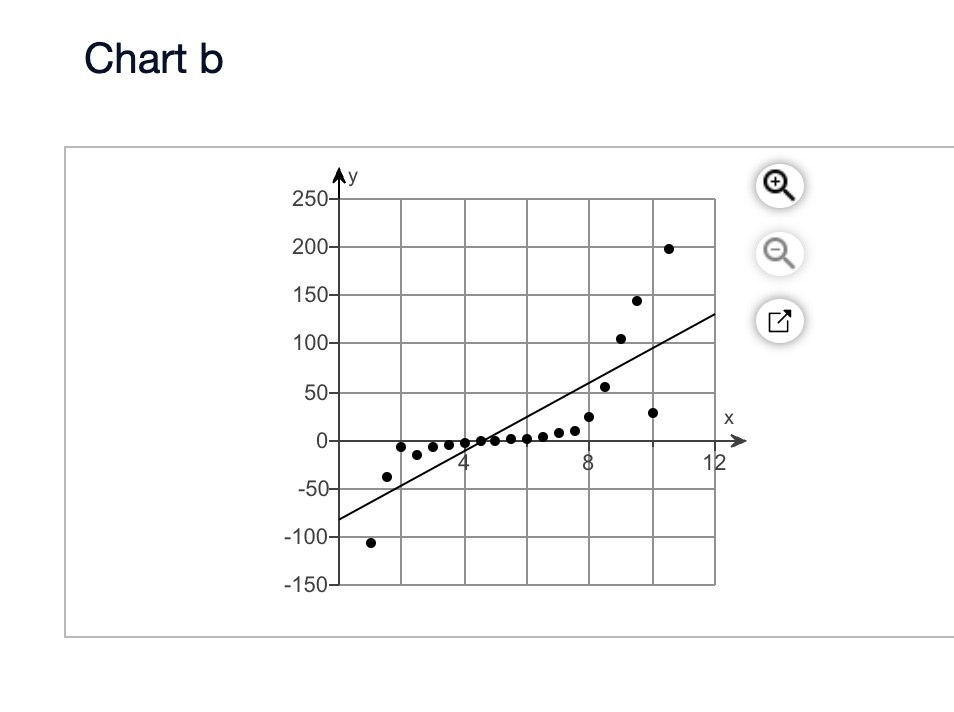
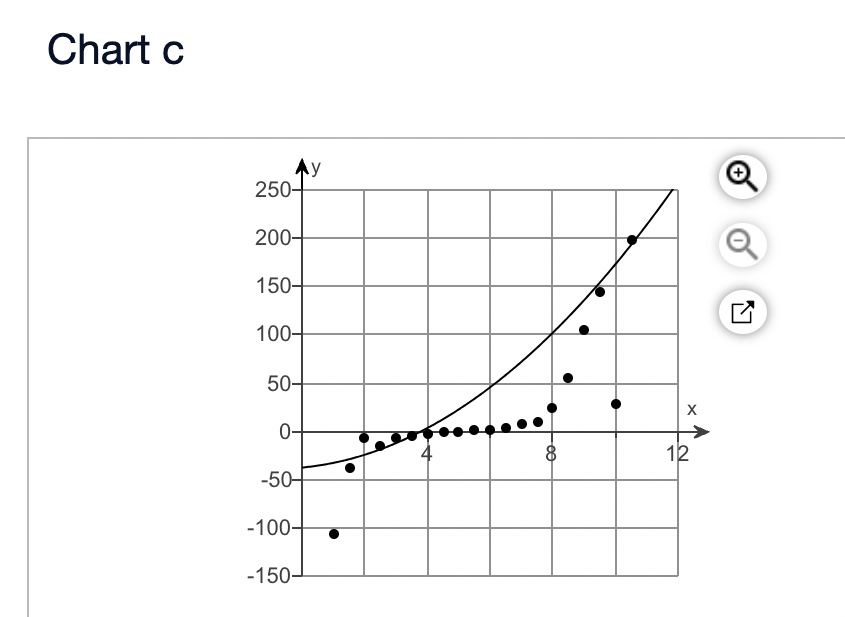
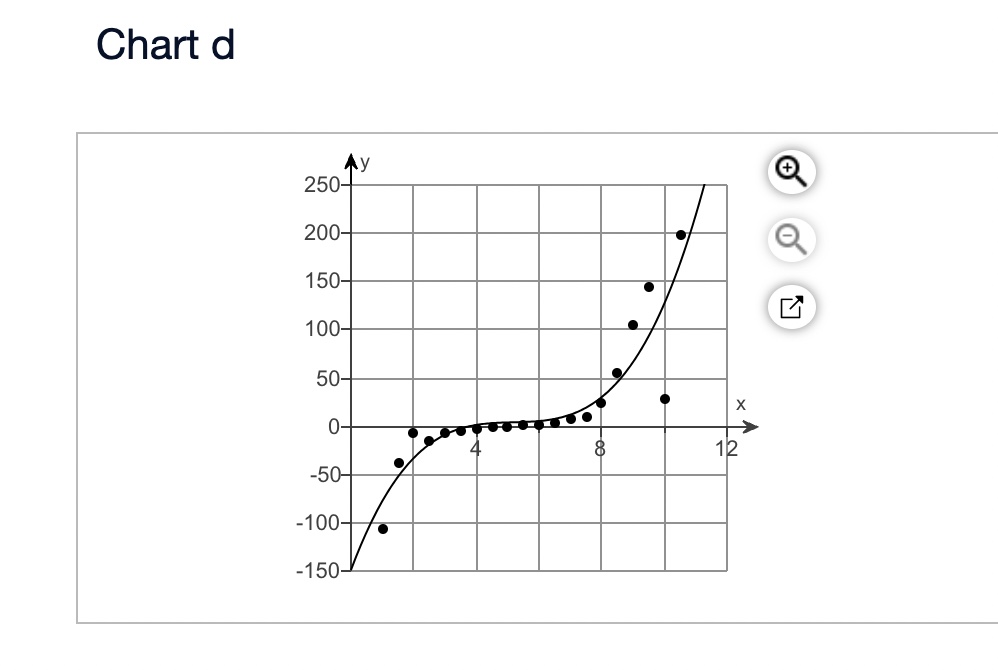
Each table in the accompanying LineFit data contains a set of data that describes a functional relationship between the dependent variable y and the independent variable x. Construct a scatter chart of each data set and use the Trendline tool in Excel to determine the?best-fitting functions to model these data sets. Do not consider polynomials beyond the third degree.
First data set:
x y
1 -105.6
1.5 -38.2
2 -6.2
2.5 -16.0
3 -6.7
3.5 -5.1
4 -3.0
4.5 -0.5
5 0.0
5.5 0.4
6 0.6
6.5 4.1
7 8.1
7.5 9.1
8 24.5
8.5 55.7
9 105.1
9.5 144.0
10 27.8
10.5 197.7
Second data set:
x y
10 16.43
10.5 13.02
11 13.02
11.5 11.67
12 12.86
12.5 11.84
13 10.88
13.5 10.93
14 11.22
14.5 10.88
15 11.25
15.5 11.12
16 11.42
16.5 10.77
17 10.95
17.5 9.77
18 7.92
18.5 9.46
19 7.50
19.5 7.62
20 6.12
Third data set:
x y
1 3.45
2 4.39
3 6.22
4 7.58
5 9.62
6 8.25
7 6.96
8 11.20
9 12.74
10 16.26
11 15.12
12 29.33
13 35.78
14 44.23
15 34.53
16 62.13
17 54.54
18 62.02
19 110.62


Step by Step Solution
There are 3 Steps involved in it
Step: 1

Get Instant Access to Expert-Tailored Solutions
See step-by-step solutions with expert insights and AI powered tools for academic success
Step: 2

Step: 3

Ace Your Homework with AI
Get the answers you need in no time with our AI-driven, step-by-step assistance
Get Started


