

Answered step by step
Verified Expert Solution
Question
1 Approved Answer
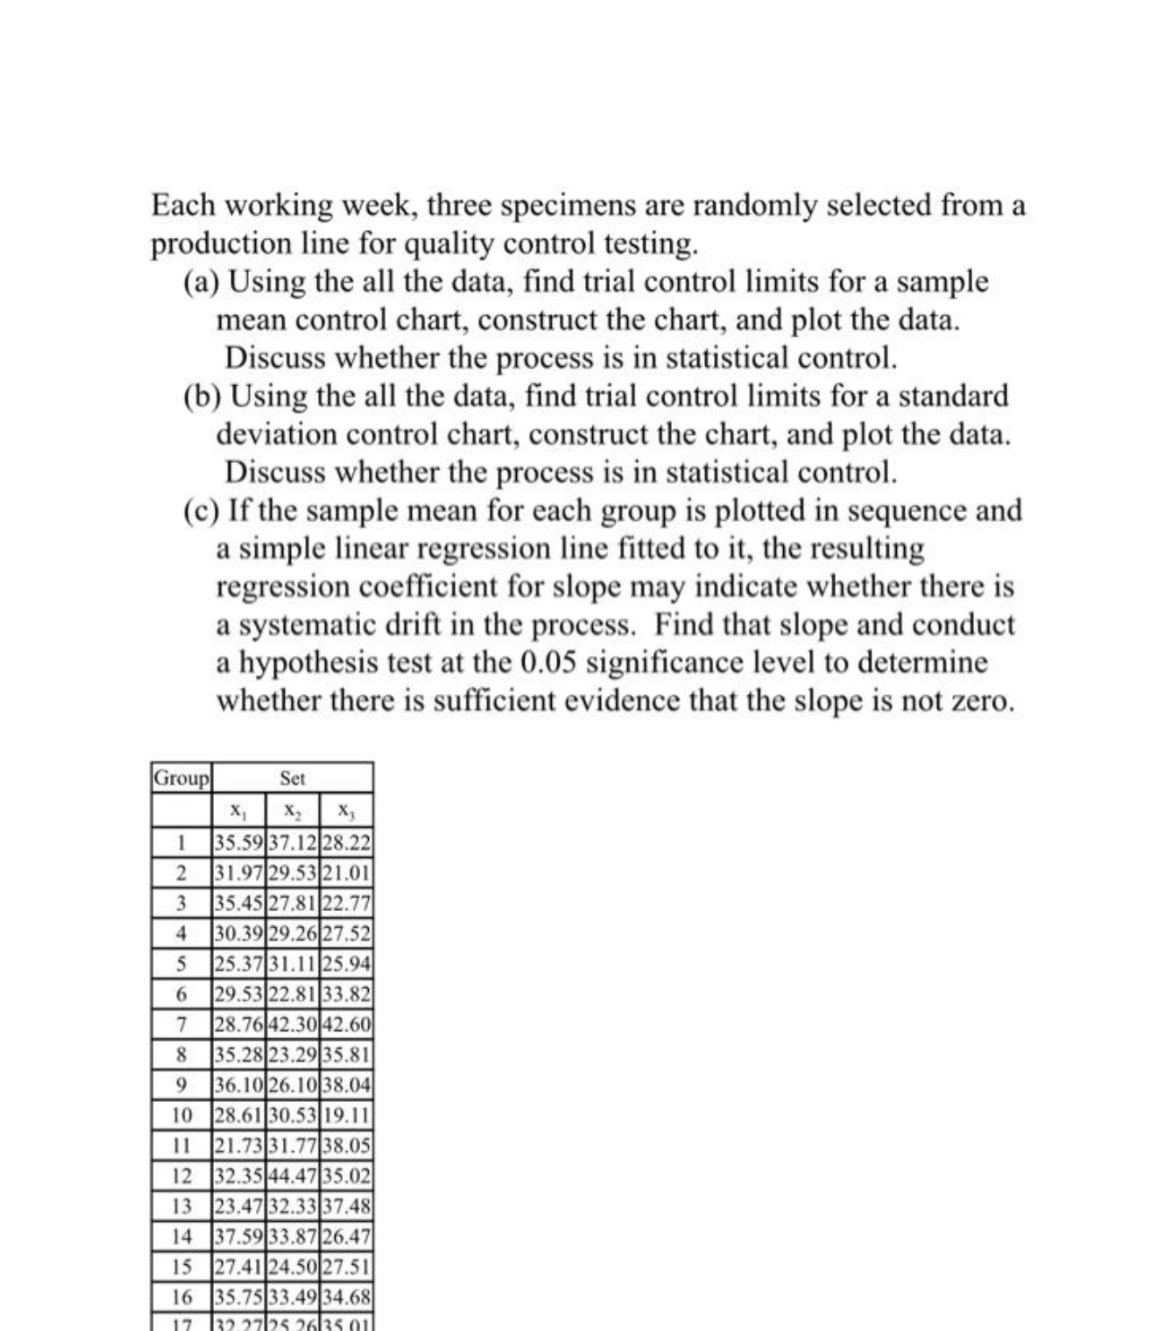
Each working week, three specimens are randomly selected from a production line for quality control testing. (a) Using the all the data, find trial control
Step by Step Solution
There are 3 Steps involved in it
Step: 1

Get Instant Access to Expert-Tailored Solutions
See step-by-step solutions with expert insights and AI powered tools for academic success
Step: 2

Step: 3
Ace Your Homework with AI
Get the answers you need in no time with our AI-driven, step-by-step assistance
Get Started
Essentials Of Measure Theory
Authors: Carlos S Kubrusly
1st Edition
3319225065, 9783319225067