Answered step by step
Verified Expert Solution
Question
1 Approved Answer
Earlier in the semester, we considered plots of position, velocity, and acceleration as functions of time and learned how to extract information from them


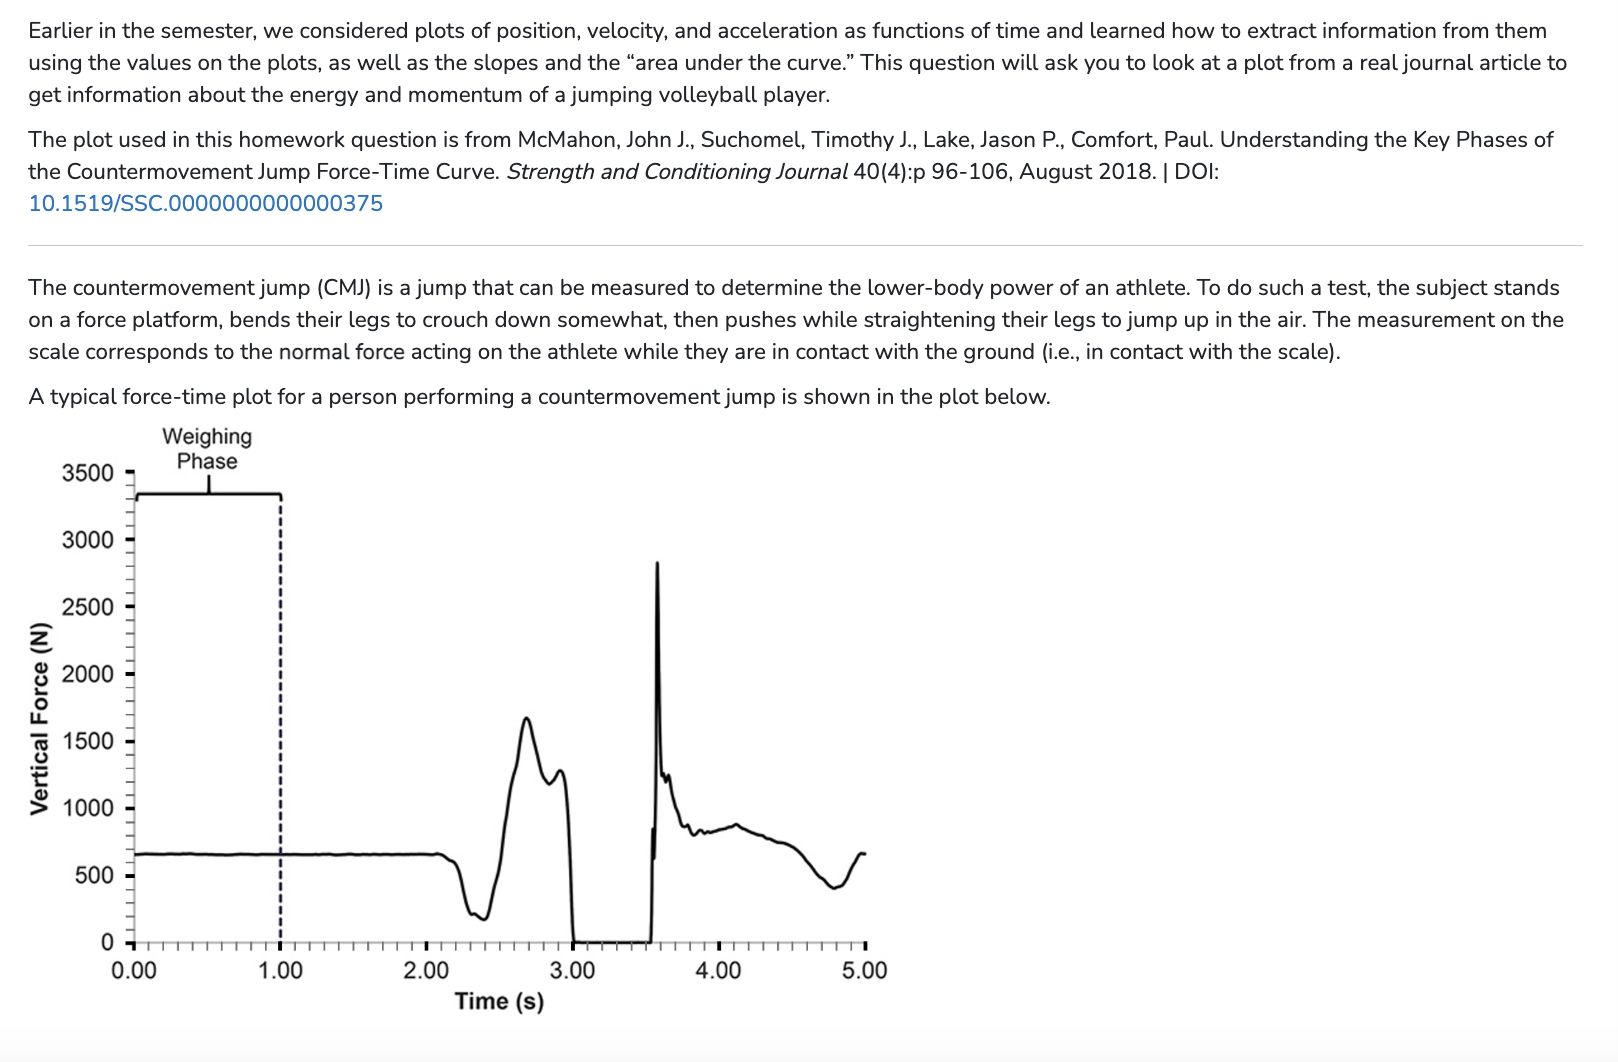
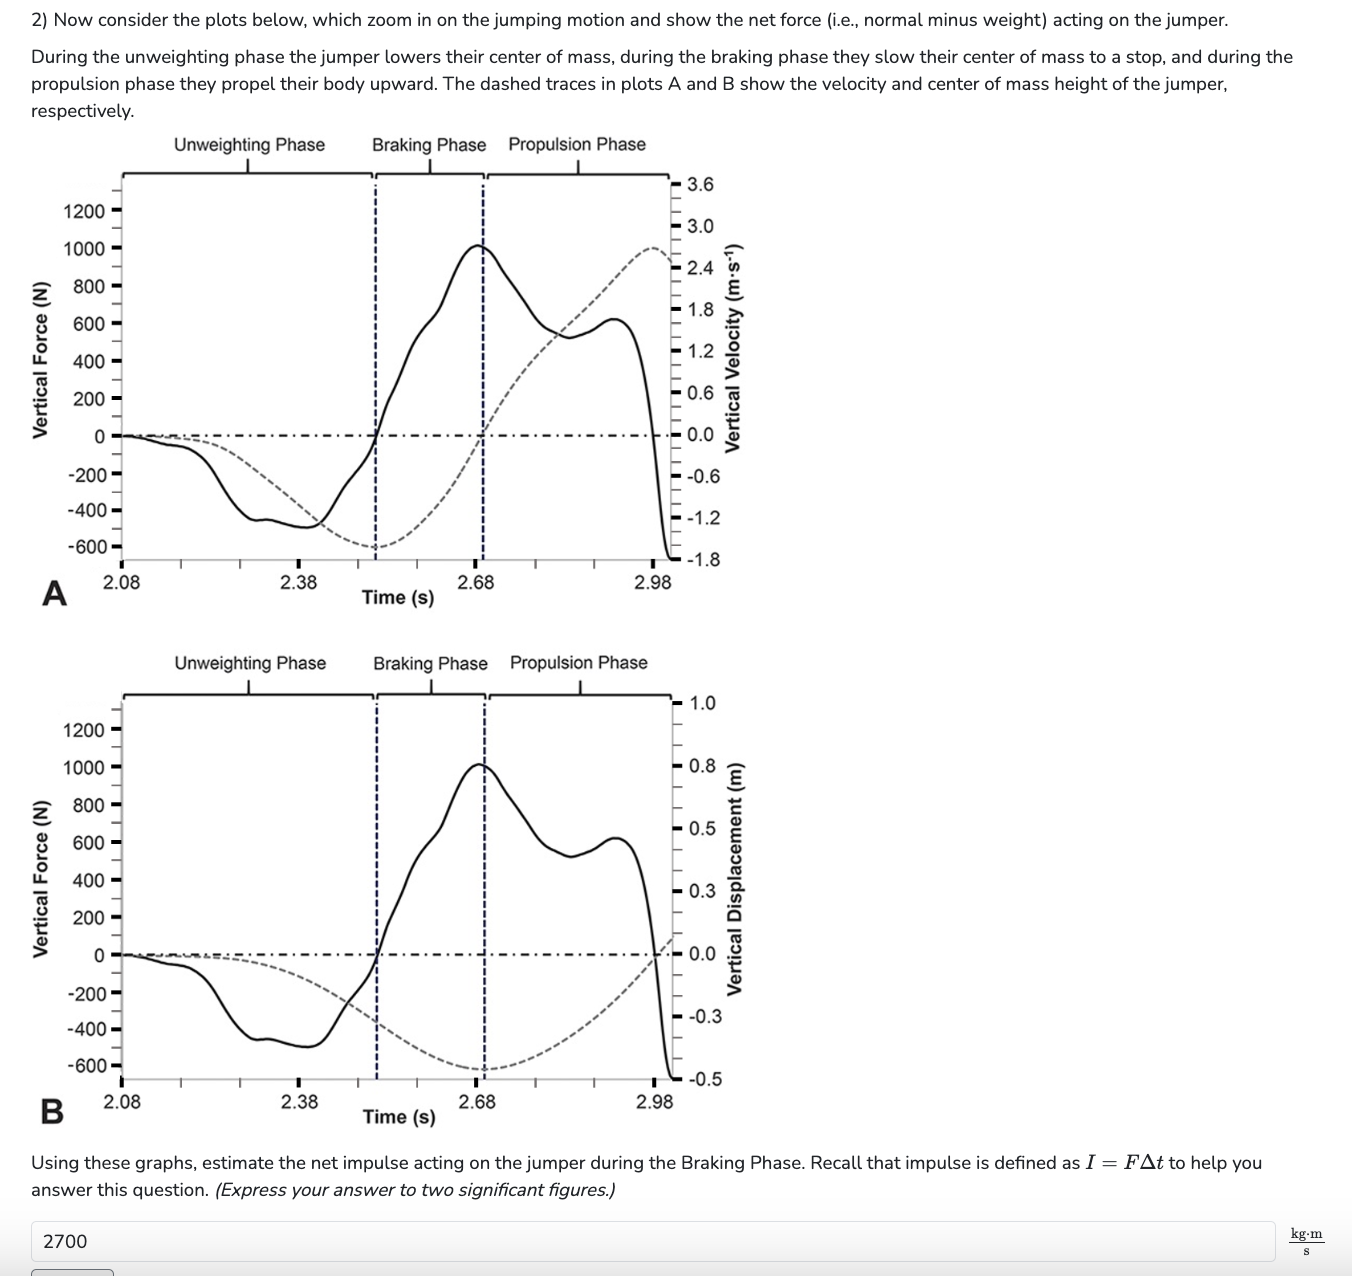
Earlier in the semester, we considered plots of position, velocity, and acceleration as functions of time and learned how to extract information from them using the values on the plots, as well as the slopes and the "area under the curve." This question will ask you to look at a plot from a real journal article to get information about the energy and momentum of a jumping volleyball player. The plot used in this homework question is from McMahon, John J., Suchomel, Timothy J., Lake, Jason P., Comfort, Paul. Understanding the Key Phases of the Countermovement Jump Force-Time Curve. Strength and Conditioning Journal 40(4):p 96-106, August 2018. | DOI: 10.1519/SSC.0000000000000375 The countermovement jump (CMJ) is a jump that can be measured to determine the lower-body power of an athlete. To do such a test, the subject stands on a force platform, bends their legs to crouch down somewhat, then pushes while straightening their legs to jump up in the air. The measurement on the scale corresponds to the normal force acting on the athlete while they are in contact with the ground (i.e., in contact with the scale). A typical force-time plot for a person performing a countermovement jump is shown in the plot below. 3500 Weighing Phase Vertical Force (N) 3000 2500 2000 1500 1000 500 0 T 0.00 1.00 2.00 3.00 4.00 5.00 Time (s) Vertical Force (N) Vertical Force (N) 2) Now consider the plots below, which zoom in on the jumping motion and show the net force (i.e., normal minus weight) acting on the jumper. During the unweighting phase the jumper lowers their center of mass, during the braking phase they slow their center of mass to a stop, and during the propulsion phase they propel their body upward. The dashed traces in plots A and B show the velocity and center of mass height of the jumper, respectively. 1200- 1000 800 600 400- 200 0 -200- -400- -600- A 2.08 1200 1000 800 600 400 200 0 -200 -400 -600- B 2.08 2700 Vertical Velocity (ms1) Unweighting Phase Braking Phase Propulsion Phase 3.6 3.0 - 2.4 1.8 1.2 0.6 0.0 -0.6 3) Based on the plot of the jumper's velocity and what you know about their weight, what is the net impulse on the jumper during the Propulsion Phase up to the time when they reach their maximum velocity (i.e., at 2.98 seconds)? Recall that we can also find net impulse by determining the change of momentum. (Express your answer to two significant figures.) Ap= Submit kg-m S
Step by Step Solution
There are 3 Steps involved in it
Step: 1

Get Instant Access to Expert-Tailored Solutions
See step-by-step solutions with expert insights and AI powered tools for academic success
Step: 2

Step: 3

Ace Your Homework with AI
Get the answers you need in no time with our AI-driven, step-by-step assistance
Get Started


