

Question
EBIT-EPS analysis is used to examine the effect of alternative plans of capital financing on the firms earnings per share (EPS), assuming a range of
EBIT-EPS analysis is used to examine the effect of alternative plans of capital financing on the firms earnings per share (EPS), assuming a range of values for the firms level of earnings before interest and taxes (EBIT). The results can be generated and presented using either a mathematical or a graphical solution.
What information is needed to perform an EBIT-EPS analysis? Check all that apply.
A graph with the firms EBIT as the X-axis scale and the firms EPS as the Y-axis scale
The current and expected future prices per share of the firms preferred stock
Projections regarding the firms future EBIT levels
The EBIT-EPS indifference point
An important piece of information produced by the EBIT-EPS analysis is the level of EBIT at which two possible financing plans generate the same EPS, such that a decision maker would be indifferent between the two plans.
Consider the case of Campbell Construction Company.
Campbell Construction Company is an unlevered firm currently earning an EBIT of $10 million, with 3 million shares of common stock outstanding and a tax rate of 40%. In anticipation of making a major acquisition, Campbell is evaluating whether to finance its future growth using either the sale of $20 million of new 10% bonds (Plan 1) or the issuance of 2 million new shares of common stock at $10 per share (Plan 2).
The firms EBIT-EPS indifference point corresponds to an EBIT of $ and an EPS of $ .
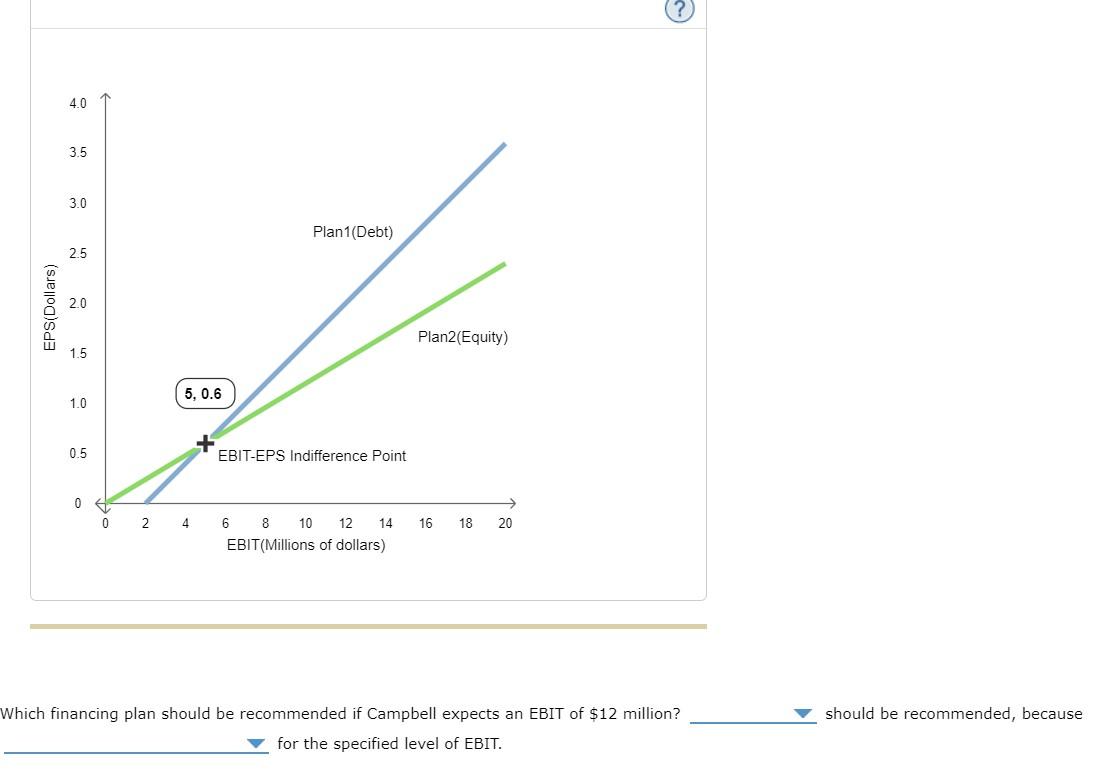
Earlier today, Campbells CFO and her staff developed two postacquisition forecasts of the firms expected EBIT. If the economy and the acquisition are expected to perform poorly, Campbells EBIT is expected to be $3 million, but if the economy and the acquisition are expected to perform well, the EBIT is expected to be $15 million. One of the staff members used this projected EBIT data and the corresponding EPS values to generate the following EBIT-EPS graph. Examine the graph and use it to answer the questions that follow.
Tool tip: Mouse over the points on the graph to see their coordinates.
024681012141618204.03.53.02.52.01.51.00.50EPS(Dollars)EBIT(Millions of dollars)Plan1(Debt)Plan2(Equity)EBIT-EPS Indifference Point5, 0.6
Which financing plan should be recommended if Campbell expects an EBIT of $12 million? should be recommended, because for the specified level of EBIT.
6. EBIT-EPS analysis EBIT-EPS analysis is used to examine the effect of alternative plans of capital financing on the firm's earnings per share (EPS), assuming a range of values for the firm's level of earnings before interest and taxes (EBIT). The results can be generated and presented using either a mathematical or a graphical solution. What information is needed to perform an EBIT-EPS analysis? Check all that apply. O A graph with the firm's EBIT as the X-axis scale and the firm's EPS as the Y-axis scale The current and expected future prices per share of the firm's preferred stock O Projections regarding the firm's future EBIT levels O The EBIT-EPS indifference point An important piece of information produced by the EBIT-EPS analysis is the level of EBIT at which two possible financing plans generate the same EPS, such that a decision maker would be indifferent between the two plans. Consider the case of Campbell Construction Company, Campbell Construction Company is an unlevered firm currently earning an EBIT of $10 million, with 3 million shares of common stock outstanding and a tax rate of 40%. In anticipation of making a major acquisition, Campbell is evaluating whether to finance its future growth using either the sale of $20 million of new 10% bonds (Plan 1) or the issuance of 2 million new shares of common stock at $10 per share (Plan 2). Consider the case of Campbell Construction Company. Campbell Construction Company is an unlevered firm currently earning an EBIT of $10 million, with 3 million shares of common stock outstanding and a tax rate of 40%. In anticipation of making a major acquisition, Campbell is evaluating whether to finance its future growth using either the sale of $20 million of new 10% bonds (Plan 1) or the issuance of 2 million new shares of common stock at $10 per share (Plan 2). The firm's EBIT-EPS indifference point corresponds to an EBIT of $ and an EPS of $ Earlier today, Campbell's CFO and her staff developed two postacquisition forecasts of the firm's expected EBIT. If the economy and the acquisition are expected to perform poorly, Campbell's EBIT is expected to be $3 million, but if the economy and the acquisition are expected to perform well, the EBIT is expected to be $15 million. One of the staff members used this projected EBIT data and the corresponding EPS values to generate the following EBIT-EPS graph. Examine the graph and use it to answer the questions that follow. 4.0 3.5 3.0 Plan1(Debt) 2.5 EPS(Dollars) Plan2(Equity) 1.5 5, 0.6 1.0 0.5 EBIT-EPS Indifference Point 0 > 20 0 2 4 16 18 6 8 10 12 14 EBIT(Millions of dollars) should be recommended, because Which financing plan should be recommended if Campbell expects an EBIT of $12 million? for the specified level of EBITStep by Step Solution
There are 3 Steps involved in it
Step: 1

Get Instant Access to Expert-Tailored Solutions
See step-by-step solutions with expert insights and AI powered tools for academic success
Step: 2

Step: 3
Ace Your Homework with AI
Get the answers you need in no time with our AI-driven, step-by-step assistance
Get Started
Regulation A+ How The JOBS Act Creates Opportunities For Entrepreneurs And Investors
Authors: Paul Getty , Dinesh Gupta , Robert R. Kaplan
1st Edition
1430257318,1430257326