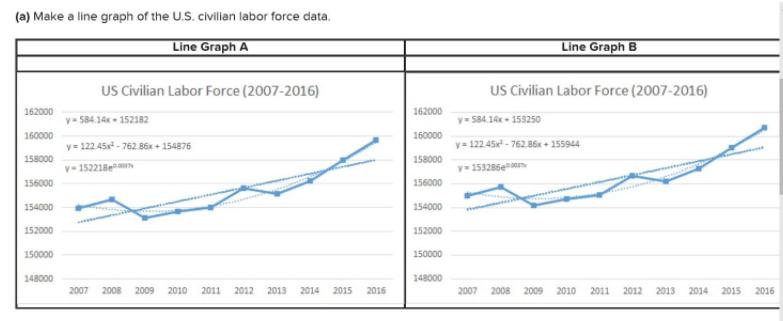
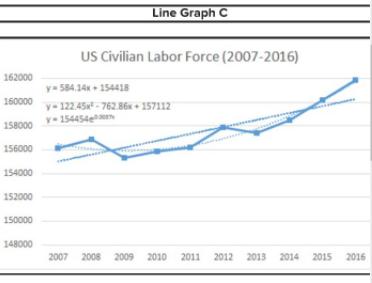
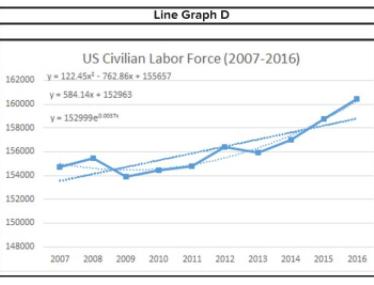
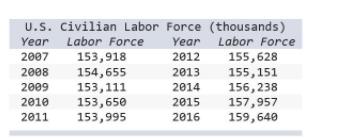
(a) Make a line graph of the U.S. civilian labor force data. Line Graph A Line...
Fantastic news! We've Found the answer you've been seeking!
Question:
Transcribed Image Text:
(a) Make a line graph of the U.S. civilian labor force data. Line Graph A Line Graph B US Civilian Labor Force (2007-2016) US Civilian Labor Force (2007-2016) 162000 162000 v- 584.14 - 152182 y- 584.14x - 153250 160000 160000 y = 12245 - 762.86 + 154876 y= 122 45x - 762.86x + 155944 158000 158000 v-152218e y153286e 156000 156000 154000 154000 152000 152000 150000 150000 148000 148000 2007 2008 2009 2010 2011 2012 2013 2014 2015 2016 2007 2008 2009 2010 2011 2012 2013 2014 2015 2016 Line Graph C US Civilian Labor Force (2007-2016) 162000 y 584.14x+ 154418 160000 y- 122.45 - 762.86 + 157112 y- 154454en 158000 156000 154000 152000 150000 148000 2007 2008 2009 2010 2011 2012 2013 2014 2015 2016 Line Graph D US Civilian Labor Force (2007-2016) 162000 y- 12245xl - 762.86x + 155657 y- 584.14- 152963 160000 v- 152999e 158000 156000 154000 152000 150000 148000 2007 2008 2009 2010 2011 2012 2013 2014 2015 2016 U.S. civilian Labor Force (thousands) Year Labor Force Year Labor Force 2007 153,918 2012 155,628 2008 154,655 153,111 153,650 153,995 2013 155,151 156,238 157,957 159,640 2009 2014 2010 2015 2011 2016 (c) Fit three trend models: linear, exponential, and quadratic. Which model would offer the most believable forecasts? (You may select more than one answer. Click the box with a check mark for the correct answer and double click to empty the box for the wrong answer.) Linear Quadratic 2 Exponential (d) Make forecasts using the following fitted trend models for years 2017-2019. (Round your answers to the nearest whole number.) Linear Quadratic Exponential 11 12 13 (a) Make a line graph of the U.S. civilian labor force data. Line Graph A Line Graph B US Civilian Labor Force (2007-2016) US Civilian Labor Force (2007-2016) 162000 162000 v- 584.14 - 152182 y- 584.14x - 153250 160000 160000 y = 12245 - 762.86 + 154876 y= 122 45x - 762.86x + 155944 158000 158000 v-152218e y153286e 156000 156000 154000 154000 152000 152000 150000 150000 148000 148000 2007 2008 2009 2010 2011 2012 2013 2014 2015 2016 2007 2008 2009 2010 2011 2012 2013 2014 2015 2016 Line Graph C US Civilian Labor Force (2007-2016) 162000 y 584.14x+ 154418 160000 y- 122.45 - 762.86 + 157112 y- 154454en 158000 156000 154000 152000 150000 148000 2007 2008 2009 2010 2011 2012 2013 2014 2015 2016 Line Graph D US Civilian Labor Force (2007-2016) 162000 y- 12245xl - 762.86x + 155657 y- 584.14- 152963 160000 v- 152999e 158000 156000 154000 152000 150000 148000 2007 2008 2009 2010 2011 2012 2013 2014 2015 2016 U.S. civilian Labor Force (thousands) Year Labor Force Year Labor Force 2007 153,918 2012 155,628 2008 154,655 153,111 153,650 153,995 2013 155,151 156,238 157,957 159,640 2009 2014 2010 2015 2011 2016 (c) Fit three trend models: linear, exponential, and quadratic. Which model would offer the most believable forecasts? (You may select more than one answer. Click the box with a check mark for the correct answer and double click to empty the box for the wrong answer.) Linear Quadratic 2 Exponential (d) Make forecasts using the following fitted trend models for years 2017-2019. (Round your answers to the nearest whole number.) Linear Quadratic Exponential 11 12 13
Expert Answer:
Related Book For
Applied Statistics in Business and Economics
ISBN: 978-0073521480
4th edition
Authors: David Doane, Lori Seward
Posted Date:
Students also viewed these economics questions
-
Use the standard error to construct a prediction interval for Yusing an alpha of 5%. (Round your answer to 2 decimal places.) Prediction interval for Y: ;
-
Use the Excel data file called Cars that you will find on Blackboard to complete this assignment Describe the distribution of each of the following variables in the file mpg engine year and cylinder...
-
(a-1) Use MegaStat or Minitab to deseasonalize Coca-Cola's quarterly data. (Round your answers to 3 decimal places.) 2 2005 2006 2007 2008 2009 2010 mean
-
Food Enterprises is analyzing the performance of their retail business and have calculated Value At Risk at $17,350,000 under the statistical method at a 95% confidence level, and a mean of $898,000....
-
Fellowes and Associates Chartered Accountants is a successful mid-tier accounting firm with a large range of clients across Canada. During the financial year 2011, Fellowes and Associates gained a...
-
Problems 5665 are based on previously learned material. The purpose of these problems is to keep the material fresh in your mind so that you are better prepared for later sections, a final exam, or...
-
For each of the following performance measures, indicate (a) whether the measure is an internal performance measure or an external performance measure and (b) whether the measure primarily relates to...
-
1. Why did Sainsbury bid for Argos? 2. With reference to the post-acquisition integration matrix (see Figure 11.3) consider how Sainsbury might best integrate Argos? 3. With reference to the buy,...
-
Suppose a retail organization wishes to predict the probability that a customer will indicate that they are satisfied with their shopping experience. They will use the independent variable Time in...
-
In a sample of 539 households from a certain Midwestern city, it was found that 133 of these households owned at least one firearm. Give a 99% confidence interval for the percentage of families in...
-
Haas Company manufactures and sells one product. The following information pertains to each of the companys first three years of operations: Variable cost per unit: Manufacturing: Direct materials $...
-
A $ 120,000 promissory note signed on April 1 maturing in 8 months and with 5% simple interest is sold to Ariel on July 14 on the basis of a return on investment of 6% ordinary compound. How much...
-
You have invested $12,000 in AAA stock, $8,000 in BBB stock, and $6,000 in CCC stock. If you expect the return on AAA to be 5% in the next year, the return on BBB to be 3%, and the return on CCC to...
-
Assume that a firm trades on both the Frankfurt Stock Exchange in Germany and on the New York Stock Exchange in the US. On the Frankfurt bourse, it closed at a price of 51.05. On the same day, the...
-
Inputs for WACC (Re computed using CAPM only) LT Debt: 8000 bonds outstanding of a 5-year maturity; 1015 = PV; 4.2% = Coupon Rate (Semiannual) Common Stock: 35,000 shares outstanding; $28 price today...
-
If the hospital is currently using the direct method, do you think (based on the differences you see) that they should switch to the sequential method? Write up your recommendation to the management...
-
Estimate the affordable monthly mortgage payment, the affordable mortgage amount, and the affordable home purchase price for the following situation. (Refer to Exhibit 9-8 and Exhibit 9-9.) Note:...
-
Annual dividends of ATTA Corp grew from $0.96 in 2005 to $1.76 in 2017. What was the annual growth rate?
-
High blood pressure, if untreated, can lead to increased risk of stroke and heart attack. A common definition of hypertension is diastolic blood pressure of 90 or more. (a) State the null and...
-
The time it takes a ski patroller to respond to an accident call has an exponential distribution with an average equal to 5 minutes. (a) In what time will 90 percent of all ski accident calls be...
-
Many college graduates will not use very much statistics during their 40-year careers, so why study it? (a) List several arguments for and against this statement. Which position do you find more...
-
What circumstances might influence the growth or shrinkage of the nonprofit sector?
-
Discuss what a productive collaboration between a nonprofit, a for - profit, and the public sector might look like.
-
If you wanted to establish a homeless shelter in your community, what are the decisions and choices you would have to make along the way?
Study smarter with the SolutionInn App