

Question
Economic and unemployment data were recorded. # # There are 16 rows of data. The data include: # # I, the index; # A1, the
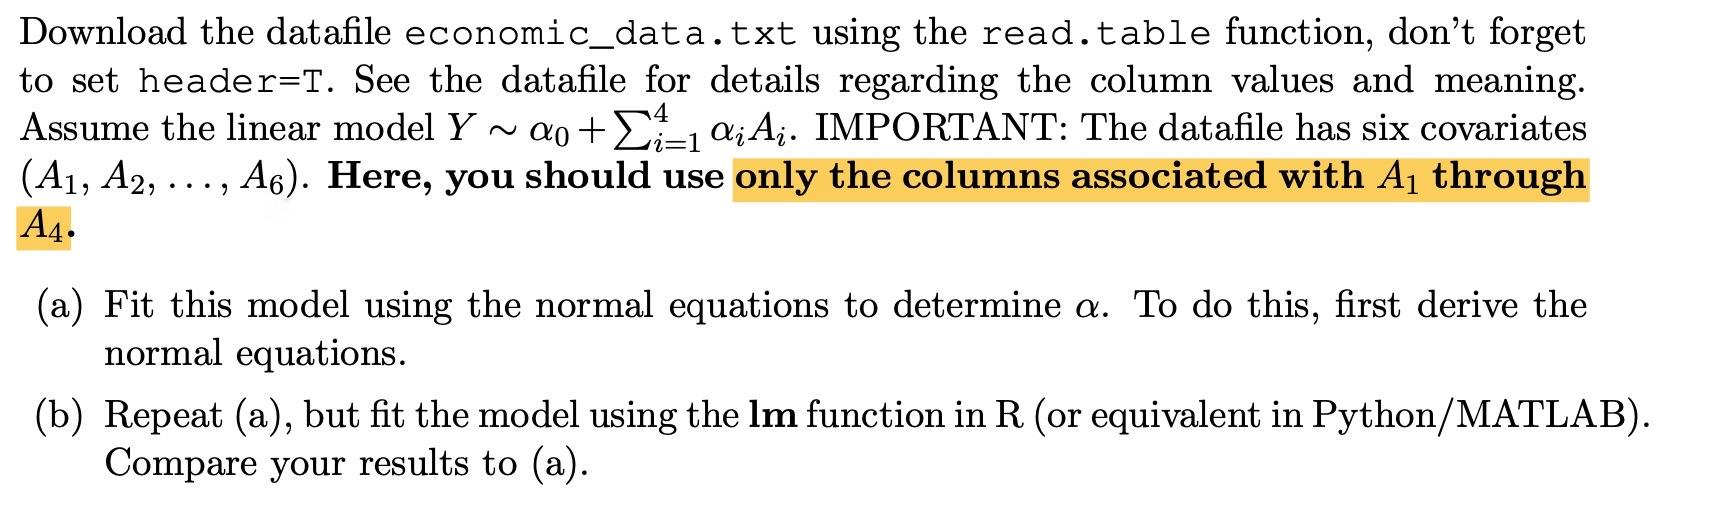 Economic and unemployment data were recorded. # # There are 16 rows of data. The data include: # # I, the index; # A1, the percentage price deflation; # A2, the GNP in millions of dollars; # A3, the number of unemployed; # A4, the number of people employed by the military; # A5, the number of people over 14; # A6, the year # Y, the number of people employed. # # A3-A5 are in units of thousands # # We seek a model of the form: # # Y = X0 + A1 * X1 + A2 * X2 + A3 * X3 + A4 * X4 + A5 * X5 + A6 *X6. # Index A1 A2 A3 A4 A5 A6 Y 1 83.0 234289 2356 1590 107608 1947 60323 2 88.5 259426 2326 1456 108632 1948 61122 3 88.2 258054 3682 1616 109773 1949 60171 4 89.5 284599 3351 1650 110929 1950 61187 5 96.2 328975 2099 3099 112075 1951 63221 6 98.1 346999 1932 3594 113270 1952 63639 7 99.0 365385 1870 3547 115094 1953 64989 8 100.0 363112 3578 3350 116219 1954 63761 9 101.2 397469 2904 3048 117388 1955 66019 10 104.6 419180 2822 2857 118734 1956 67857 11 108.4 442769 2936 2798 120445 1957 68169 12 110.8 444546 4681 2637 121950 1958 66513 13 112.6 482704 3813 2552 123366 1959 68655 14 114.2 502601 3931 2514 125368 1960 69564 15 115.7 518173 4806 2572 127852 1961 69331 16 116.9 554894 4007 2827 130081 1962 70561
Step by Step Solution
There are 3 Steps involved in it
Step: 1

Get Instant Access to Expert-Tailored Solutions
See step-by-step solutions with expert insights and AI powered tools for academic success
Step: 2

Step: 3
Ace Your Homework with AI
Get the answers you need in no time with our AI-driven, step-by-step assistance
Get Started
Graph Databases In Action
Authors: Dave Bechberger, Josh Perryman
1st Edition
1617296376, 978-1617296376