Answered step by step
Verified Expert Solution
Link Copied!

Question

1 Approved Answer

Economics 481 Fall 2022 Problem Set #1 For each of the following problems, use R to find your answers. Show me the R code you
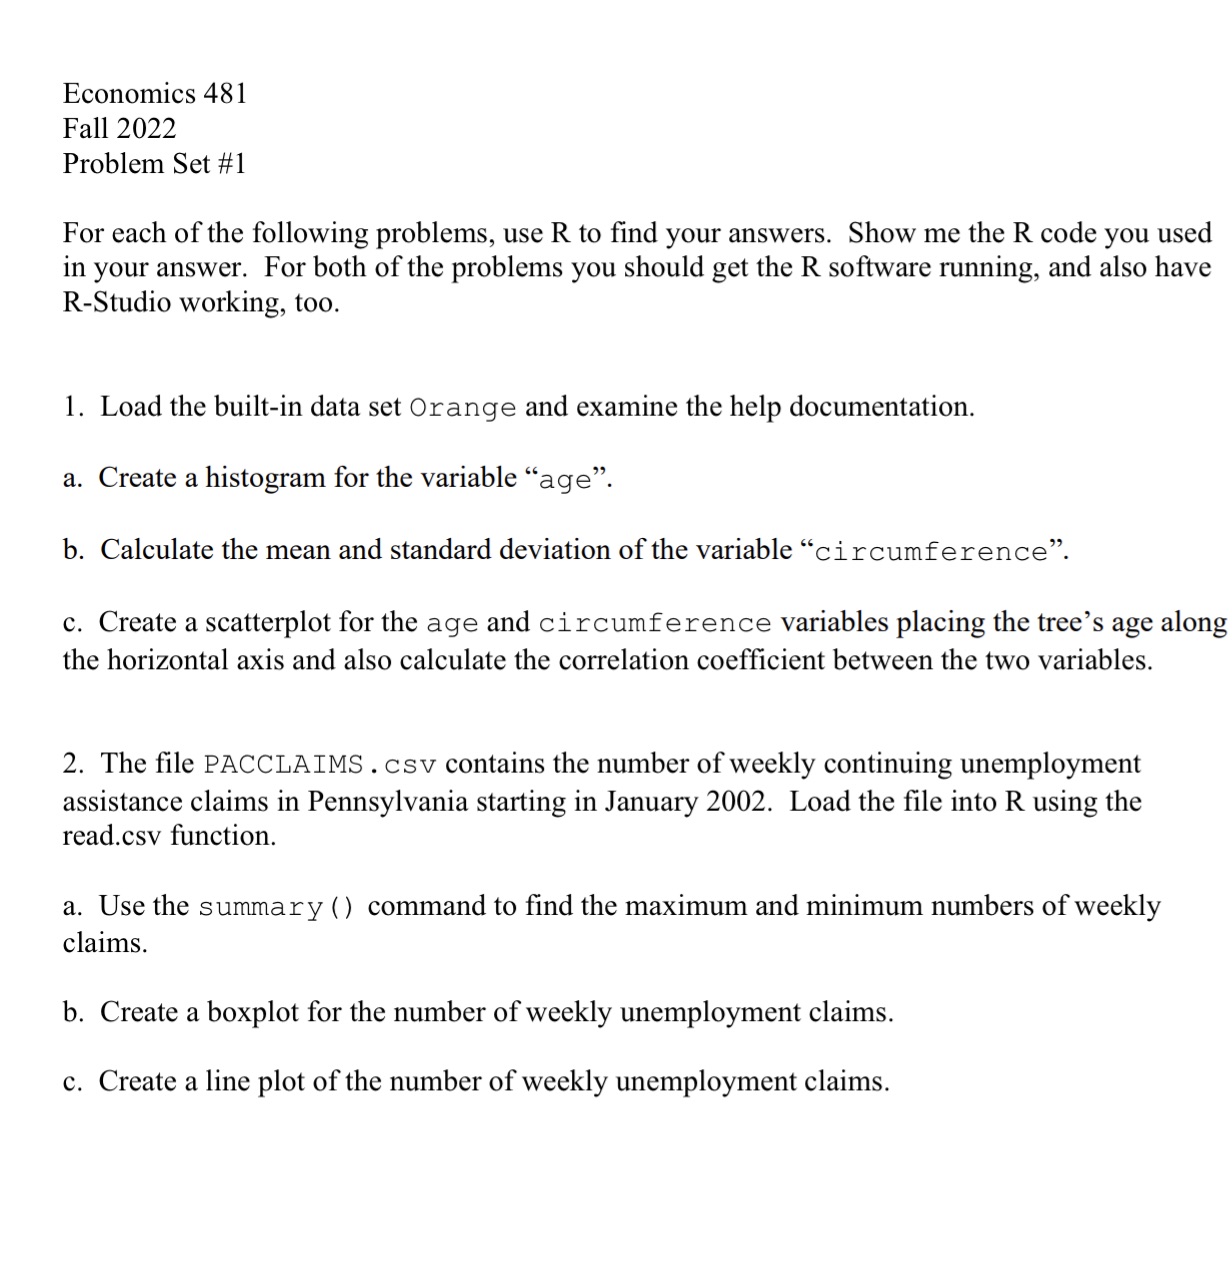
image text in transcribed
Economics 481 Fall 2022 Problem Set #1 For each of the following problems, use R to find your answers. Show me the R code you used in your answer. For both of the problems you should get the R software running, and also have R-Studio working, too. 1. Load the built-in data set Orange and examine the help documentation. a. Create a histogram for the variable "age". b. Calculate the mean and standard deviation of the variable "circumference". c. Create a scatterplot for the age and circumference variables placing the tree's age along the horizontal axis and also calculate the correlation coefficient between the two variables. 2. The file PACCLAIMS . csy contains the number of weekly continuing unemployment assistance claims in Pennsylvania starting in January 2002. Load the file into R using the read.csv function. a. Use the summary ( ) command to find the maximum and minimum numbers of weekly claims. b. Create a boxplot for the number of weekly unemployment claims. c. Create a line plot of the number of weekly unemployment claims

Step by Step Solution

There are 3 Steps involved in it

Step: 1

blur-text-image

Get Instant Access to Expert-Tailored Solutions

See step-by-step solutions with expert insights and AI powered tools for academic success

Step: 2

blur-text-image_2

Step: 3

blur-text-image_3

Ace Your Homework with AI

Get the answers you need in no time with our AI-driven, step-by-step assistance

Get Started

Recommended Textbook for

Managerial Economics and Business Strategy

Authors: Michael R. baye

7th Edition

978-0073375960, 71267441, 73375969, 978-0071267441

More Books

Students also viewed these Economics questions