Answered step by step
Verified Expert Solution
Question
1 Approved Answer
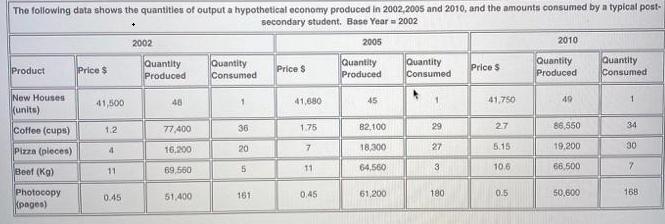
The following data shows the quantities of output a hypothetical economy produced in 2002,2005 and 2010, and the amounts consumed by a typical post-
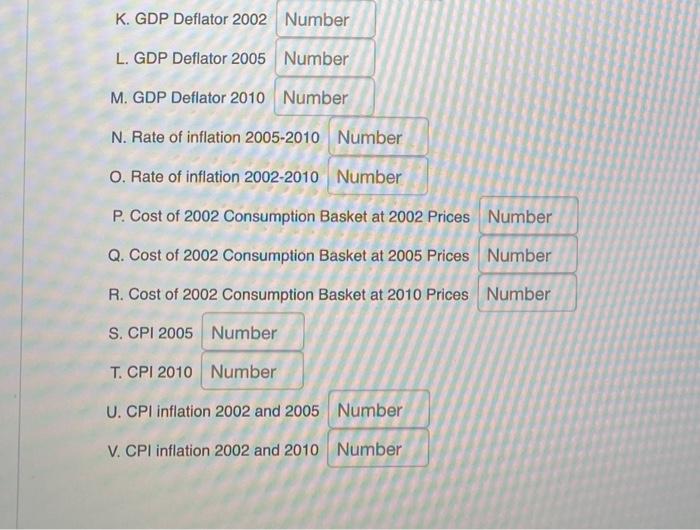
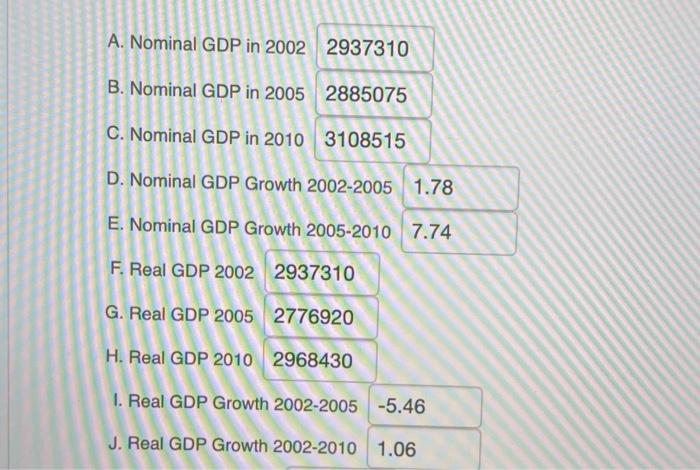
The following data shows the quantities of output a hypothetical economy produced in 2002,2005 and 2010, and the amounts consumed by a typical post- secondary student. Base Year = 2002 Product New Houses (units) Coffee (cups) Pizza (pieces) Beef (Kg) Photocopy Kpages) Price $ 41,500 1.2 4 11 0.45 2002 Quantity Produced 46 77,400 16,200 69,560 51,400 Quantity Consumed 1. 36 20 5 161 Price $ 41,680 1.75 7 11 0,45 2005 Quantity Produced 45 82,100 18,300 64,560 61,200 Quantity Consumed 27 3 180 Price $ 41,750 27 5.15 10.6 0.5 2010 Quantity Produced 49 86,550 19,200 66,500 50,600 Quantity Consumed 34 30 7 168 K. GDP Deflator 2002 Number L. GDP Deflator 2005 Number M. GDP Deflator 2010 Number N. Rate of inflation 2005-2010 Number O. Rate of inflation 2002-2010 Number P. Cost of 2002 Consumption Basket at 2002 Prices Number Q. Cost of 2002 Consumption Basket at 2005 Prices Number R. Cost of 2002 Consumption Basket at 2010 Prices Number S. CPI 2005 Number T. CPI 2010 Number U. CPI inflation 2002 and 2005 Number V. CPI inflation 2002 and 2010 Number A. Nominal GDP in 2002 2937310 B. Nominal GDP in 2005 2885075 C. Nominal GDP in 2010 3108515 D. Nominal GDP Growth 2002-2005 1.78 E. Nominal GDP Growth 2005-2010 7.74 F. Real GDP 2002 2937310 G. Real GDP 2005 2776920 H. Real GDP 2010 2968430 1. Real GDP Growth 2002-2005 -5.46 J. Real GDP Growth 2002-2010 1.06
Step by Step Solution
★★★★★
3.49 Rating (159 Votes )
There are 3 Steps involved in it
Step: 1
ANSWERS Chegg policy requires to solve first 4 parts ...
Get Instant Access to Expert-Tailored Solutions
See step-by-step solutions with expert insights and AI powered tools for academic success
Step: 2

Step: 3

Ace Your Homework with AI
Get the answers you need in no time with our AI-driven, step-by-step assistance
Get Started


