Answered step by step
Verified Expert Solution
Question
1 Approved Answer
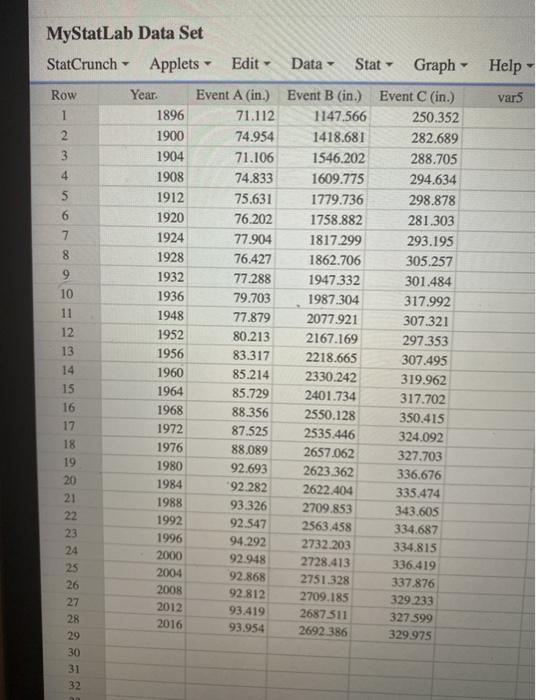
9.5.29 Question Help The accompanying data provide the winning distances for three separate competitions in a long-running international sporting event Develop forecasting models for


9.5.29 Question Help The accompanying data provide the winning distances for three separate competitions in a long-running international sporting event Develop forecasting models for each of the events Click the icon to view the winning distance data. Develop a forecasting model for Event A. Select the correct choice below and fill in the answer bix within your choice. (Round to three decimal places as needed.) 41.79 or 100 pts OA. It is appropriate to include all of the data, and there is a clear linear trend, but seasonality is not present, so a double exponential smoothing model may be the best option. For a=0.5 and fl=0.8, the double exponential smoothing model forecast for the next event is Fin B. It is not appropriate to include all the data, so a moving average model may be the best option. The two-period moving average forecast for the next event is three-period moving average forecast for the next event is in, and the four-period moving average forecast for the next event is in OC. It is appropriate to include all of the data, seasonality is present, and there is a clear trend, so a Holt-Winters model may be the best option. For a 0.5, -0.8, and y=0.4, the Holl-Winters additive seasonality model forecast for the next event is F-1" in, and the Holt-Winters multiplicative seasonality model forecast for the next event is F.1" in. in, the MyStatLab Data Set StatCrunch- Row 1 3 4 5 6 7 8 9 10 11 12 13 14 15 16 17 18 19 20 21 22 23 24 25 26 27 28 29 30 31 32 30 T Applets Edit Year. 1896 1900 1904 1908 1912 1920 1924 1928 1932 1936 1948 1952 1956 1960 1964 1968 1972 1976 1980 1984 1988 1992 1996 2000 2004 2008 2012 2016 Y Event A (in.) 71.112 74.954 71.106 74.833 75.631 76.202 77.904 76.427 77.288 79.703 77.879 80.213 83.317 85.214 85.729 88.356 87.525 88.089 92.693 92.282 93.326 92.547 94.292 92.948 92.868 92.812 93.419 93.954 Data- Event B (in.) 1147.566 1418.681 1546.202 1609.775 1779.736 1758.882 1817.299 1862.706 1947.332 1987.304 2077.921 2167.169 2218.665 2330.242 2401.734 Stat T 2550.128 2535.446 2657.062 2623.362 2622.404 2709.853 2563.458 2732 203 2728.413 2751.328 2709.185 2687.511 2692.386 Graph- Event C (in.) 250.352 282.689 288.705 294.634 298.878 281.303 293.195 305.257 301.484 317.992 307.321 297.353 307.495 319.962 317.702 350.415 324.092 327.703 336.676 335.474 343.605 334.687 334.815 336.419 337.876 329.233 T 327.599 329.975 Help var5 Y
Step by Step Solution
★★★★★
3.32 Rating (149 Votes )
There are 3 Steps involved in it
Step: 1

Get Instant Access to Expert-Tailored Solutions
See step-by-step solutions with expert insights and AI powered tools for academic success
Step: 2

Step: 3

Ace Your Homework with AI
Get the answers you need in no time with our AI-driven, step-by-step assistance
Get Started


