Answered step by step
Verified Expert Solution
Link Copied!

Question

1 Approved Answer

EDA gives you a clear idea about your features. It also helps to capture any trend or seasonality of data points. Use Box plot to
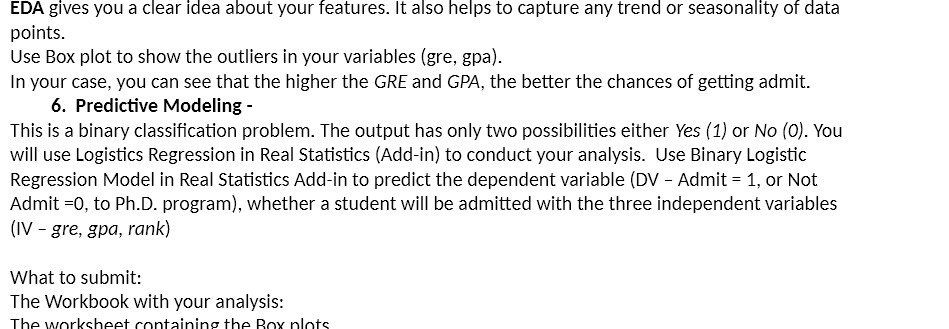
image text in transcribed
EDA gives you a clear idea about your features. It also helps to capture any trend or seasonality of data points. Use Box plot to show the outliers in your variables {gre, gpa). In your case, you can see that the higher the GRE and GPA. the better the chances of getting admit. 6. Predictive Modeling - This is a binary classication problem. The output has only two possibilities either Yes {1] or No (0). You will use Logistics Regression in Real Statistics (Addin) to conduct your analysis. Use Binary Logistic Regression Model in Real Statistics Addin to predict the dependent variable (DV Admit = 1, or Not Admit =0, to PhD. program), whether a student will be admitted with the three independent variables (IV gre, gpa, rank} What to submit: The Workbook with your analysis: Thr-s wnrkthpt rnntainino H'HJ Rm: nlntc

Step by Step Solution

There are 3 Steps involved in it

Step: 1

blur-text-image

Get Instant Access to Expert-Tailored Solutions

See step-by-step solutions with expert insights and AI powered tools for academic success

Step: 2

blur-text-image

Step: 3

blur-text-image

Ace Your Homework with AI

Get the answers you need in no time with our AI-driven, step-by-step assistance

Get Started

Recommended Textbook for

Calculus

Authors: Dale Varberg, Edwin J. Purcell, Steven E. Rigdon

9th edition

ISBN: 131429248, 978-0131429246

More Books

Students also viewed these Mathematics questions