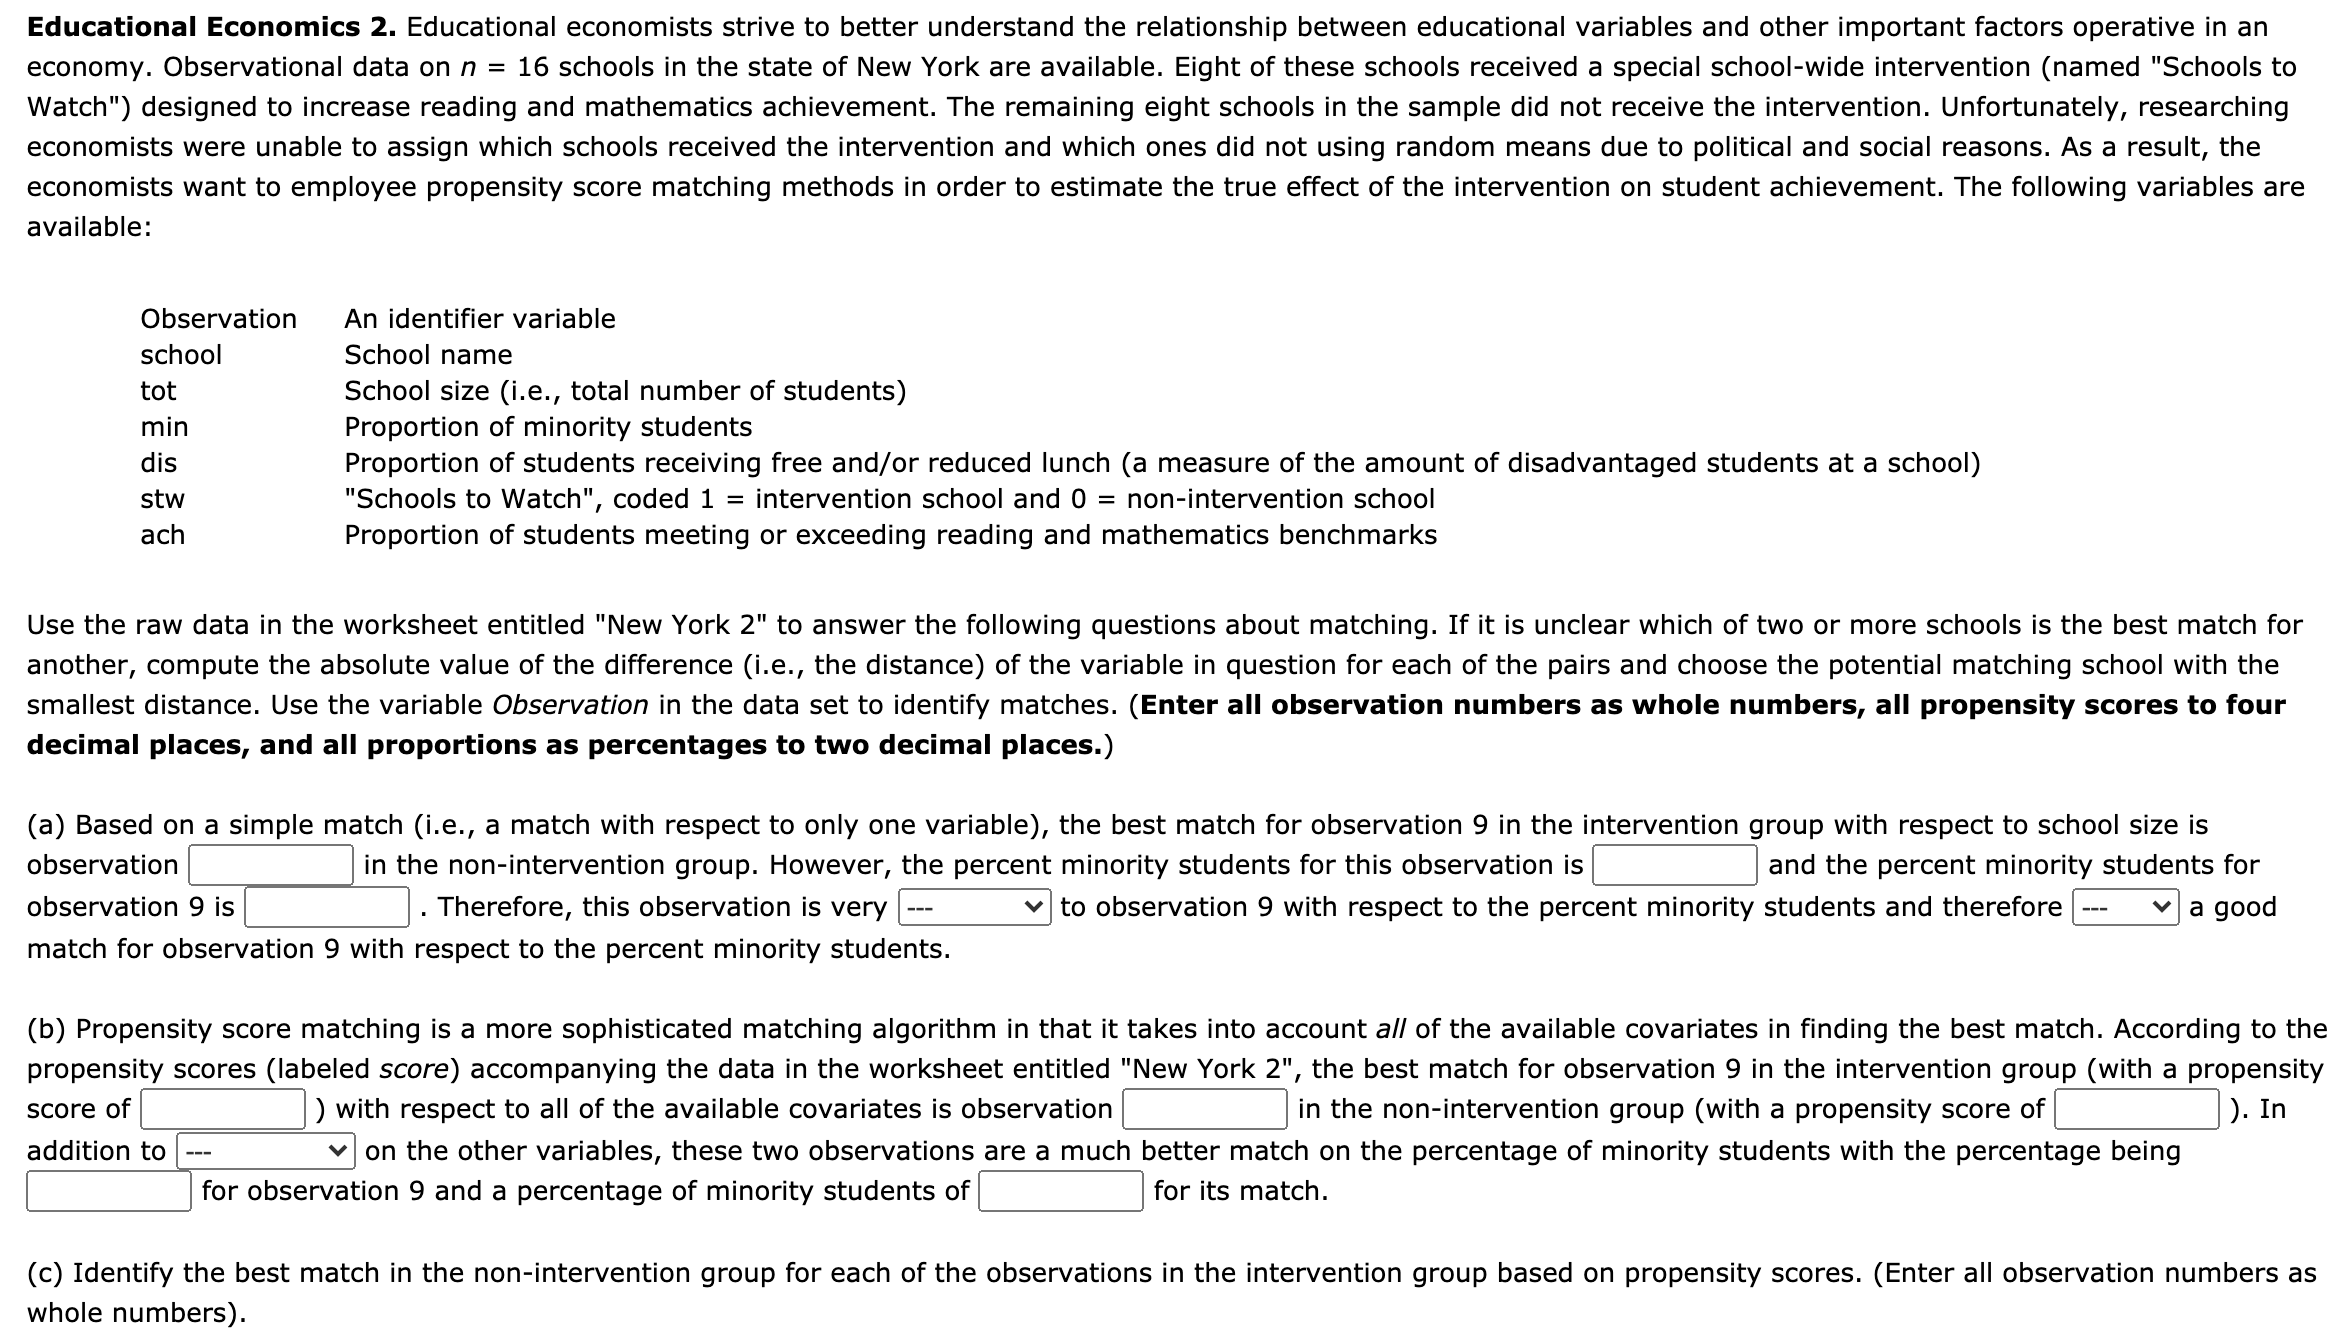
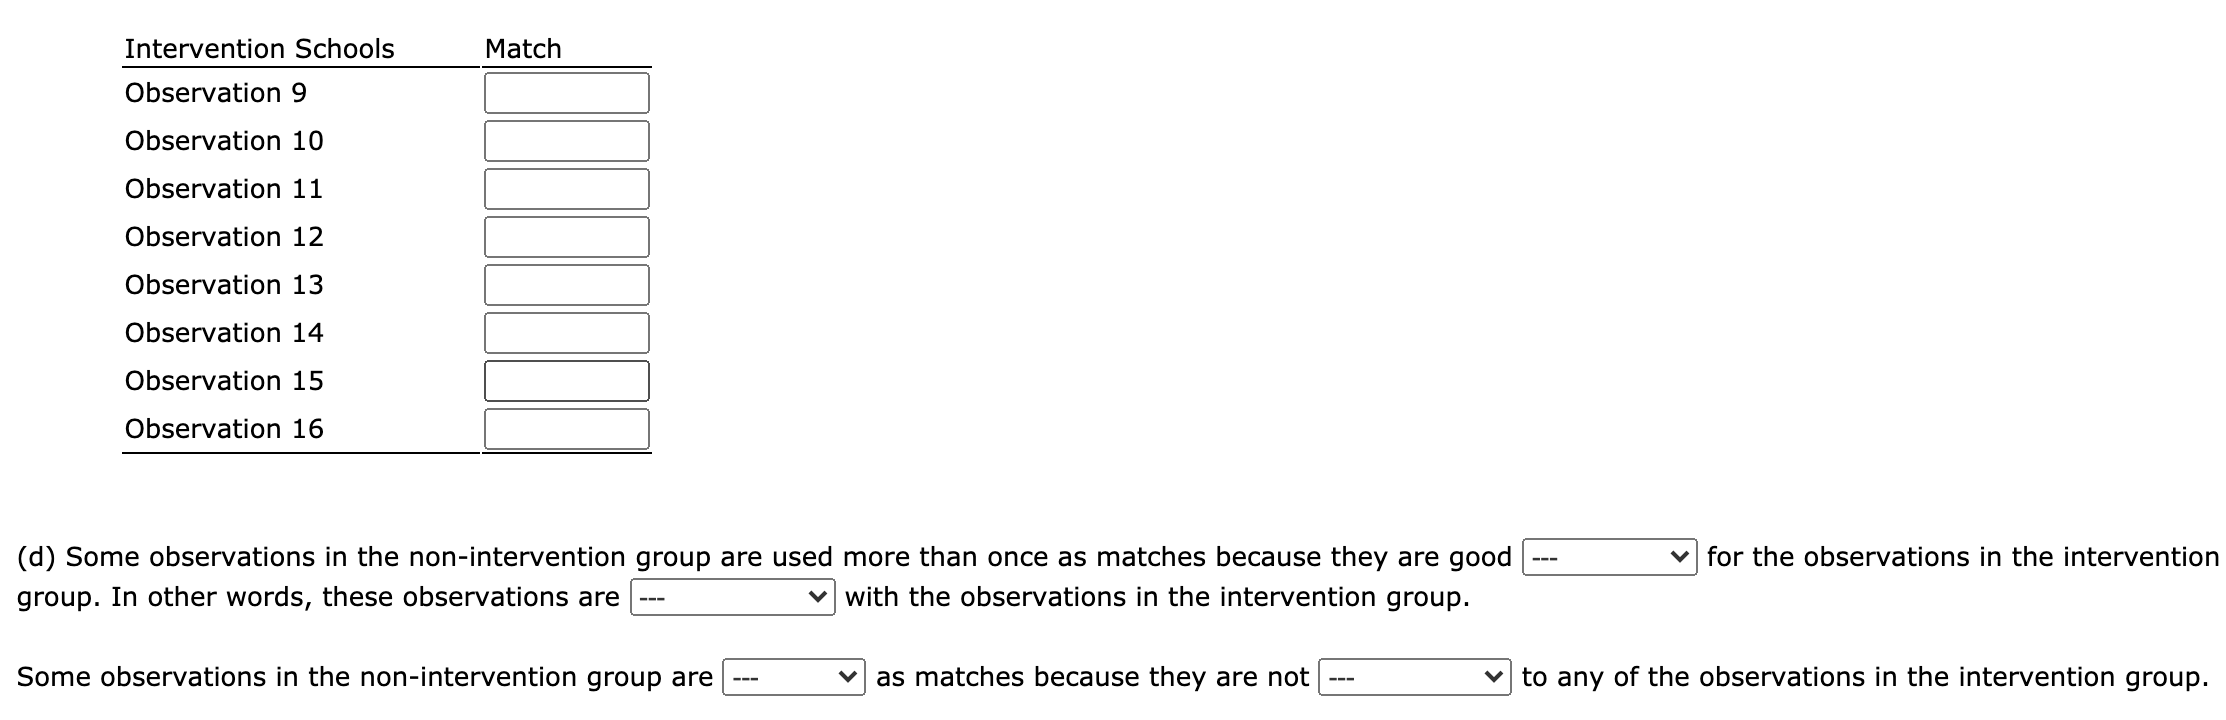
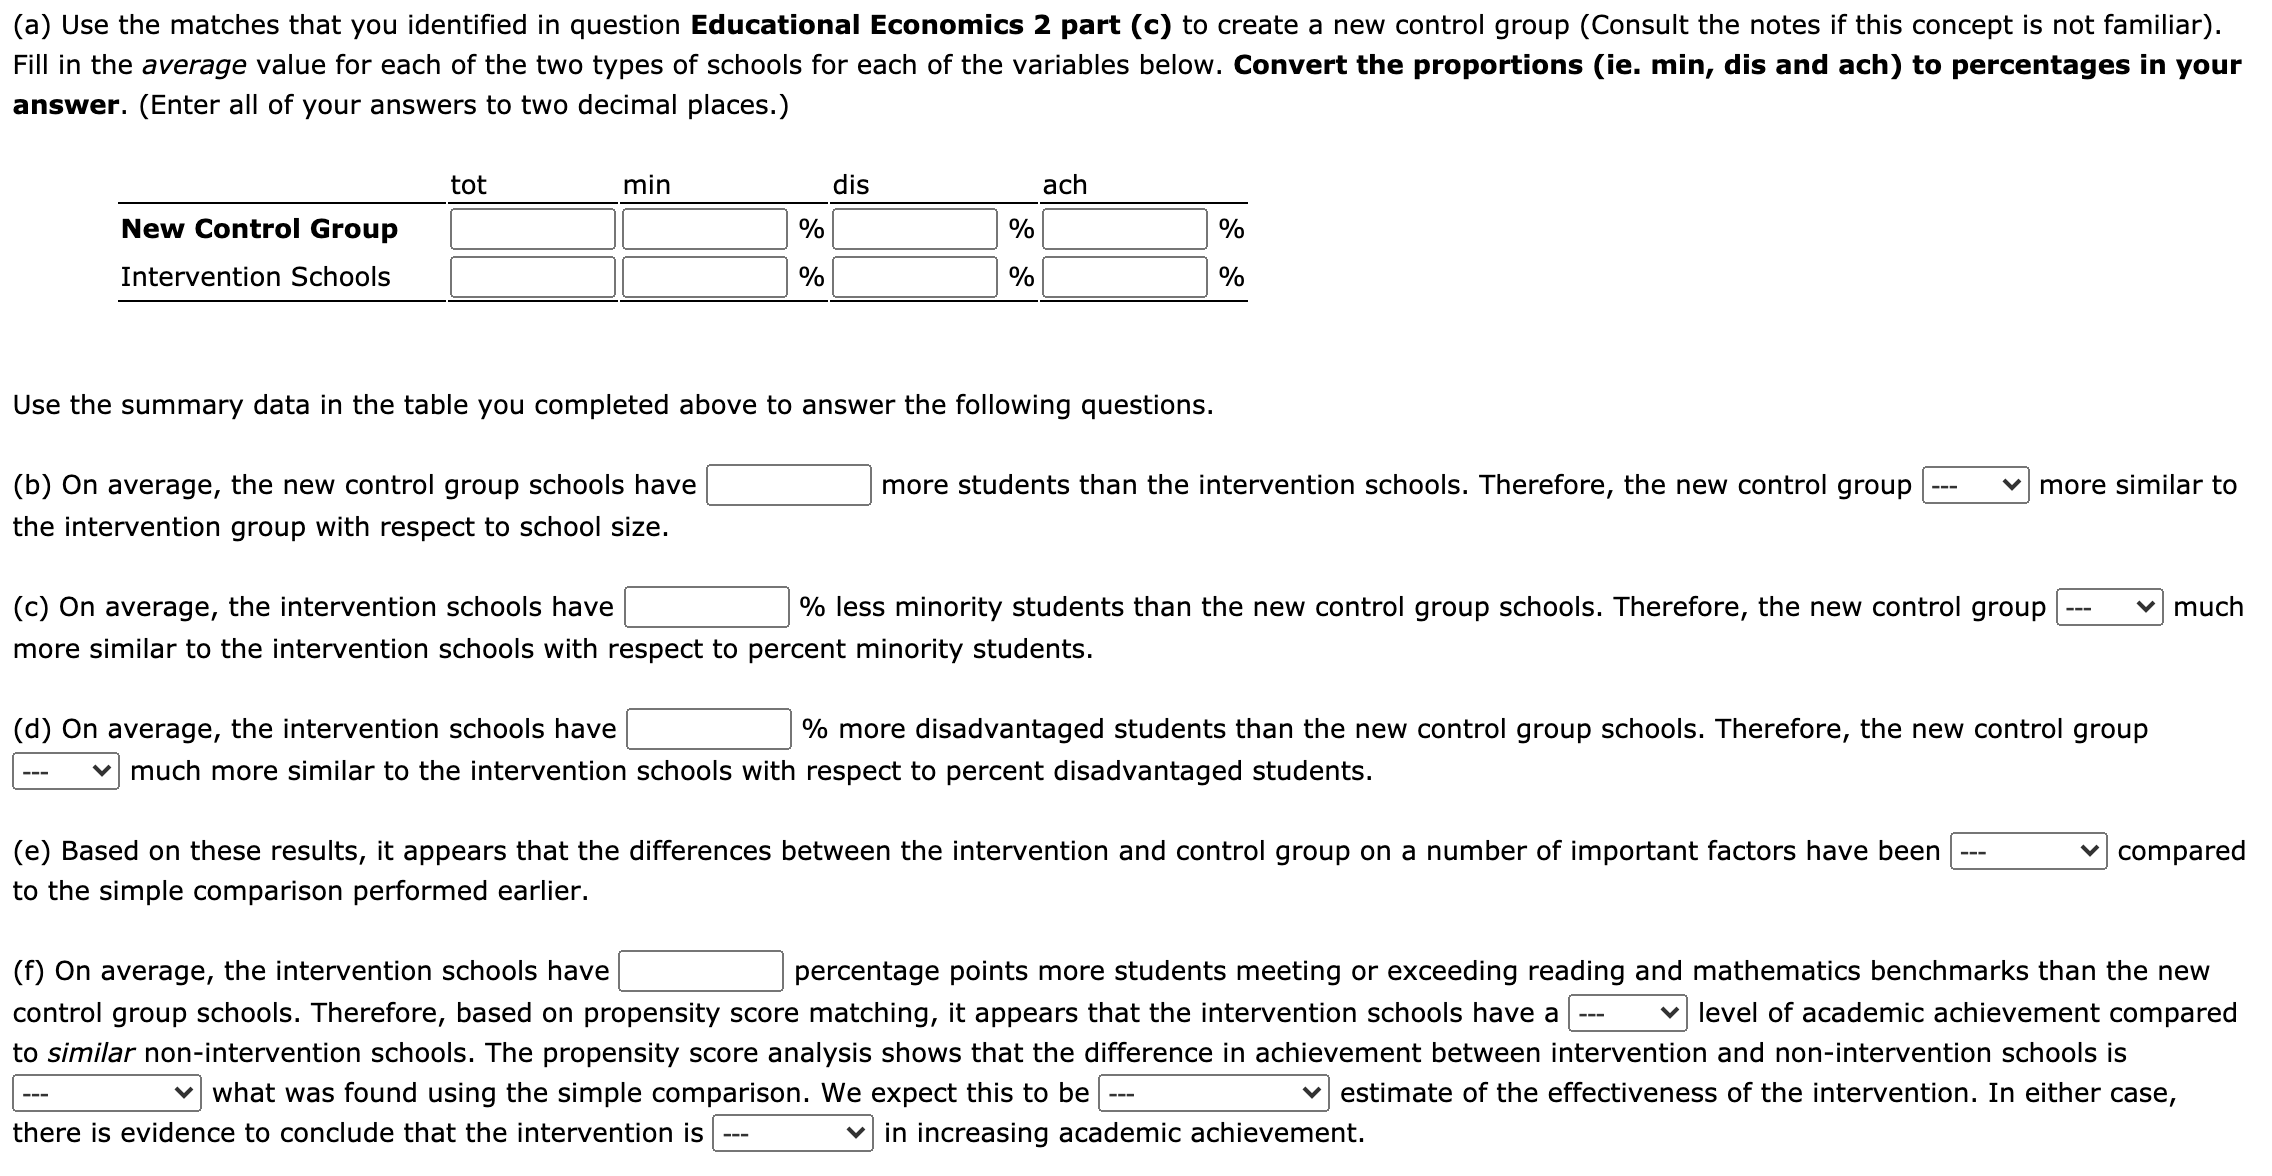
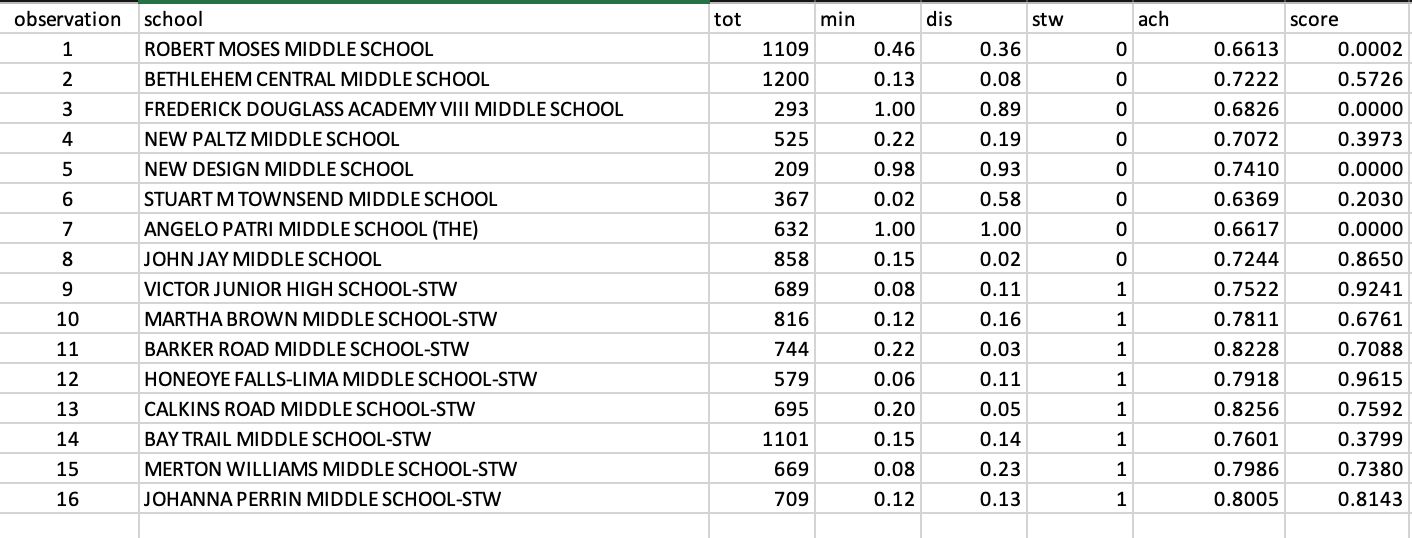
Educational Economics 2. Educational economists strive to better understand the relationship between educational variables and other important factors operative in an economy. Observational data on n = 16 schools in the state of New York are available. Eight of these schools received a special school-wide intervention (named "Schools to Watch") designed to increase reading and mathematics achievement. The remaining eight schools in the sample did not receive the intervention. Unfortunately, researching economists were unable to assign which schools received the intervention and which ones did not using random means due to political and social reasons. As a result, the economists want to employee propensity score matching methods in order to estimate the true effect of the intervention on student achievement. The following variables are available: Observation An identier variable school School name tot School size (i.e., total number of students) min Proportion of minority students dis Proportion of students receiving free and/or reduced lunch (a measure of the amount of disadvantaged students at a school) stw "Schools to Watch", coded 1 = intervention school and 0 = non-intervention school ach Proportion of students meeting or exceeding reading and mathematics benchmarks Use the raw data in the worksheet entitled "New York 2" to answer the following questions about matching. If it is unclear which of two or more schools is the best match for another, compute the absolute value of the difference (i.e., the distance) of the variable in question for each of the pairs and choose the potential matching school with the smallest distance. Use the variable Observation in the data set to identify matches. (Enter all observation numbers as whole numbers, all propensity scores to four decimal places, and all proportions as percentages to two decimal places.) (a) Based on a simple match (i.e., a match with respect to only one variable), the best match for observation 9 in the intervention group with respect to school size is observation in the non-intervention group. However, the percent minority students for this observation is and the percent minority students for observation 9 is . Therefore, this observation is very --- v to observation 9 with respect to the percent minority students and therefore - v a good match for observation 9 with respect to the percent minority students. (b) Propensity score matching is a more sophisticated matching algorithm in that it takes into account all of the available covariates in nding the best match. According to the propensity scores (labeled scare) accompanying the data in the worksheet entitled "New York 2", the best match for observation 9 in the intervention group (with a propensity score of ) with respect to all of the available covariates is observation in the non-intervention group (with a propensity score of ). In addition to --- v on the other variables, these two observations are a much better match on the percentage of minority students with the percentage being for observation 9 and a percentage of minority students of for its match. (c) Identify the best match in the non-intervention group for each of the observations in the intervention group based on propensity scores. (Enter all observation numbers as whole numbers). Intervention Schools Match Observation 9 Observation 10 Observation 11 Observation 12 Observation 13 Observation 14 Observation 15 Observation 16 (d) Some observations in the non-intervention group are used more than once as matches because they are good with the observations in the intervention group. group. In other words, these observations are Some observations in the non-intervention group are V v as matches because they are not --- V for the observations in the intervention to any of the observations in the intervention group. (a) Use the matches that you identified in question Educational Economics 2 part (c) to create a new control group (Consult the notes if this concept is not familiar). Fill in the average value for each of the two types of schools for each of the variables below. Convert the proportions (ie. min, dis and ach) to percentages in your answer. (Enter all of your answers to two decimal places.) tot min dis ach New Control Group % % % Intervention Schools % % % Use the summary data in the table you completed above to answer the following questions. (b) On average, the new control group schools have more students than the intervention schools. Therefore, the new control group --- v more similar to the intervention group with respect to school size. (c) On average, the intervention schools have % less minority students than the new control group schools. Therefore, the new control group much more similar to the intervention schools with respect to percent minority students. (d) On average, the intervention schools have % more disadvantaged students than the new control group schools. Therefore, the new control group --- v much more similar to the intervention schools with respect to percent disadvantaged students. (e) Based on these results, it appears that the differences between the intervention and control group on a number of important factors have been --- v compared to the simple comparison performed earlier. (f) On average, the intervention schools have percentage points more students meeting or exceeding reading and mathematics benchmarks than the new control group schools. Therefore, based on propensity score matching, it appears that the intervention schools have a --- v level of academic achievement compared to similar non-intervention schools. The propensity score analysis shows that the difference in achievement between intervention and non-intervention schools is --- v what was found using the simple comparison. We expect this to be --- v estimate of the effectiveness of the intervention. In either case, there is evidence to conclude that the intervention is --- v in increasing academic achievement. observation school tot min dis stw ach score ROBERT MOSES MIDDLE SCHOOL 1109 0.46 0.36 0 0.6613 0.0002 BETHLEHEM CENTRAL MIDDLE SCHOOL 1200 0.13 0.08 0 0.7222 0.5726 FREDERICK DOUGLASS ACADEMY VIII MIDDLE SCHOOL 293 1.00 0.89 0 0.6826 0.0000 NEW PALTZ MIDDLE SCHOOL 525 0.22 0.19 0 0.7072 0.3973 NEW DESIGN MIDDLE SCHOOL 209 0.98 0.93 0 0.7410 0.0000 6 STUART M TOWNSEND MIDDLE SCHOOL 367 0.02 0.58 0 0.6369 0.2030 ANGELO PATRI MIDDLE SCHOOL (THE) 632 1.00 1.00 0 0.6617 0.0000 8 JOHN JAY MIDDLE SCHOOL 858 0.15 0.02 0 0.7244 0.8650 9 VICTOR JUNIOR HIGH SCHOOL-STW 689 0.08 0.11 0.7522 0.9241 10 MARTHA BROWN MIDDLE SCHOOL-STW 816 0.12 0.16 0.7811 0.6761 11 BARKER ROAD MIDDLE SCHOOL-STW 744 0.22 0.03 0.8228 0.7088 12 HONEOYE FALLS-LIMA MIDDLE SCHOOL-STW 579 0.06 0.11 0.7918 0.9615 13 CALKINS ROAD MIDDLE SCHOOL-STW 695 0.20 0.05 0.8256 0.7592 14 BAY TRAIL MIDDLE SCHOOL-STW 1101 0.15 0.14 0.7601 0.3799 15 MERTON WILLIAMS MIDDLE SCHOOL-STW 669 0.08 0.23 0.7986 0.7380 16 JOHANNA PERRIN MIDDLE SCHOOL-STW 709 0.12 0.13 0.8005 0.8143