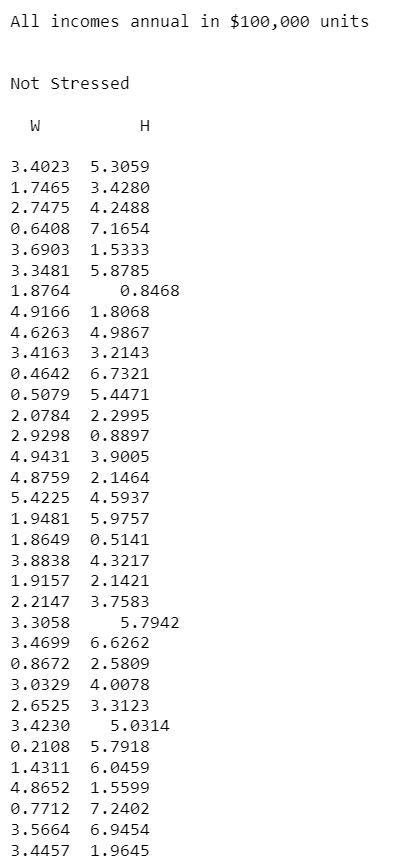
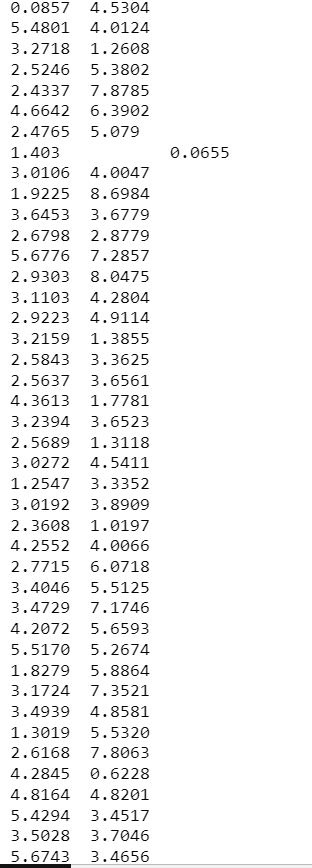
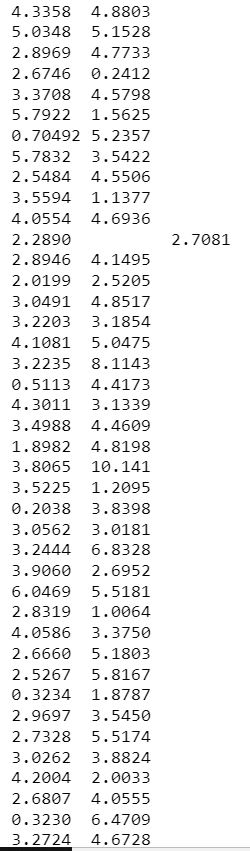
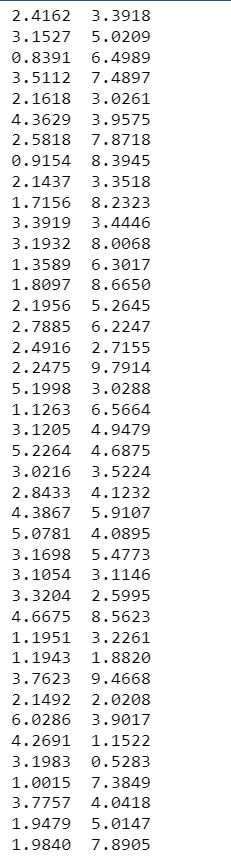
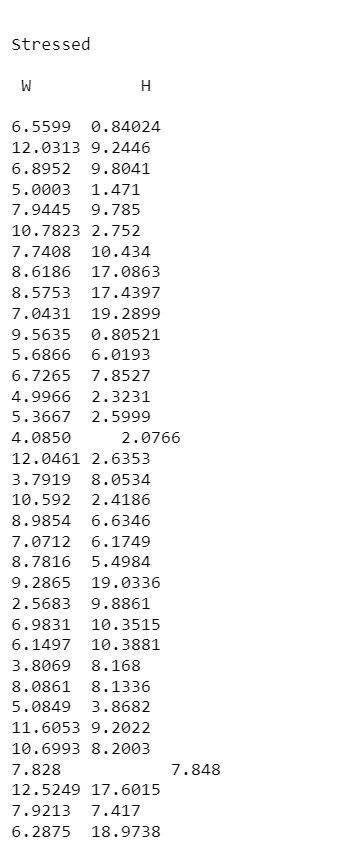
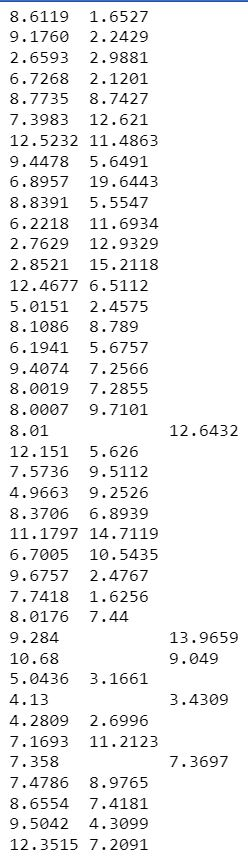
EECE 5136/6036: Homework 2 Given 10/6/2018, Due 10/23/2018 1. (100 points) A team of sociologists is doing a study of two-income couples living in Silicon Valley to determine a relationship between the incomes of the husband (H) and the wife (W) and their self-assessed level of stress. They have collected data from about 300 couples and classified each one into one of two classes: Stressed (S1), and Not Stressed (S 0). They now want to come up with a classifier that can predict the stress class of new couples based on H and W You will try two different approaches to the task .A k-nearest neighbors (k-NN) classifier A single perceptron. . You should write programs that implement each classifier and run them on the data set. You should divide data into training and test sets. Also, think about the numerical ranges of the data to see whether any prior scaling is needed. For the k-NN classifier, you can try the basic version with different values of k, or try augmented versions with weighted distances or some other augmentation. You should present your results in a brief report providing the following information: A brief description and justification of your overall strategy (i.e., how you use the data for training and testing). . What k values and/or augmentation you chose for k-NN, and why. . A graph showing Error Rate (Hit-Rate of the perceptron before training and then every 50 epochs (I epoch one training run over all training data points). The graph will have "Epoch" as its x-axis and "Error Rate" as its y-axis. You should test performance on both the training set and the test set at each point (though the test set will not be used for training), and plot both curves on the same graph. For the perceptron, two bar graphs, each with 5 bars- one showing the final Hit-Rate, Sensitivity, Specificity, PPV, and NPV values on the training set after training, and the other showing the same for the test set. If you wish, you can plot the two sets of bars on the same graph, with the two bars for each metric next to each other . A bar graph for the same 5 metries for the best k-NN algorithm you found, but only on the test set (there is no training in k-NN; the training set is used only as a labeled reference set). . .Plots of the data in the H-W plane indicating the decision boundaries found by the classifiers. For the k-NN classifiers, this will involve sampling the H-W plane as I explained in class, and will only give an approximate boundary EECE 5136/6036: Homework 2 Given 10/6/2018, Due 10/23/2018 1. (100 points) A team of sociologists is doing a study of two-income couples living in Silicon Valley to determine a relationship between the incomes of the husband (H) and the wife (W) and their self-assessed level of stress. They have collected data from about 300 couples and classified each one into one of two classes: Stressed (S1), and Not Stressed (S 0). They now want to come up with a classifier that can predict the stress class of new couples based on H and W You will try two different approaches to the task .A k-nearest neighbors (k-NN) classifier A single perceptron. . You should write programs that implement each classifier and run them on the data set. You should divide data into training and test sets. Also, think about the numerical ranges of the data to see whether any prior scaling is needed. For the k-NN classifier, you can try the basic version with different values of k, or try augmented versions with weighted distances or some other augmentation. You should present your results in a brief report providing the following information: A brief description and justification of your overall strategy (i.e., how you use the data for training and testing). . What k values and/or augmentation you chose for k-NN, and why. . A graph showing Error Rate (Hit-Rate of the perceptron before training and then every 50 epochs (I epoch one training run over all training data points). The graph will have "Epoch" as its x-axis and "Error Rate" as its y-axis. You should test performance on both the training set and the test set at each point (though the test set will not be used for training), and plot both curves on the same graph. For the perceptron, two bar graphs, each with 5 bars- one showing the final Hit-Rate, Sensitivity, Specificity, PPV, and NPV values on the training set after training, and the other showing the same for the test set. If you wish, you can plot the two sets of bars on the same graph, with the two bars for each metric next to each other . A bar graph for the same 5 metries for the best k-NN algorithm you found, but only on the test set (there is no training in k-NN; the training set is used only as a labeled reference set). . .Plots of the data in the H-W plane indicating the decision boundaries found by the classifiers. For the k-NN classifiers, this will involve sampling the H-W plane as I explained in class, and will only give an approximate boundary