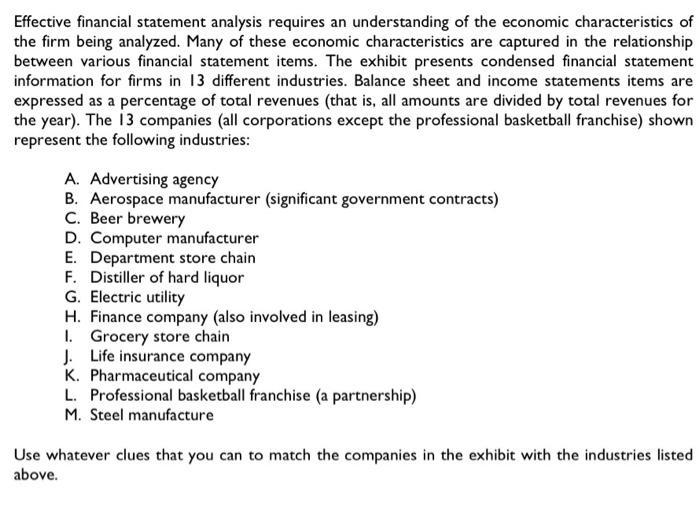
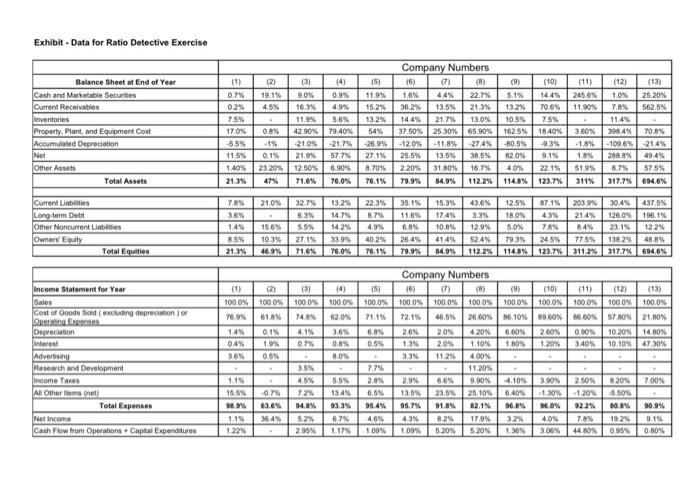
Effective financial statement analysis requires an understanding of the economic characteristics of the firm being analyzed. Many of these economic characteristics are captured in the relationship between various financial statement items. The exhibit presents condensed financial statement information for firms in 13 different industries. Balance sheet and income statements items are expressed as a percentage of total revenues (that is, all amounts are divided by total revenues for the year). The 13 companies (all corporations except the professional basketball franchise) shown represent the following industries: A. Advertising agency B. Aerospace manufacturer (significant government contracts) C. Beer brewery D. Computer manufacturer E. Department store chain F. Distiller of hard liquor G. Electric utility H. Finance company (also involved in leasing) 1. Grocery store chain J. Life insurance company K. Pharmaceutical company L. Professional basketball franchise (a partnership) M. Steel manufacture Use whatever clues that you can to match the companies in the exhibit with the industries listed above. Exhibit - Data for Ratio Detective Exercise (2) 19.1% 45% TE Balance Sheet at End of Year Cash and Marketable Securities Current Receivables Inventories Property. Plant, and Equipment Cost Accumulated Depreciation Net Other Assets Total Assets (1) 0.7% 02% 7.5% 17.0% -5.5% 11.5% 1.40% 11 0.8% .1% 0.1% 23 20% 47% (3) 9.0% 16.3% 11.9% 42.90% -21.0% 21.9% 12.50% 71.8% Company Numbers 15) 7) (8) 1.6% 44% 22.7% 36.2% 13.5% 21.3% 14.4% 21.7% 13.0% 37.50% 25 30% 65.90% -120% -11.8% -274% 25.5% 13.5% 38.5% 2.20% 31.50% 16.7% 79.9% 84.9% 112.2% 14) (5) 0.9% 11.9% 4.94 152% 5.6% 13.2% 79.40% 54% -217% -26.9% 57.7% 27.1% 6.90% 8.70% 76.0% 76.1% (9) (10) 5.1% 144% 13.2% 70.5% 10.5% 75% 1625% 18.40 -80.5% 93% 820% 9.1% 40% 22.1% 114.8% 123.7% (11) (12) (13) 245.6% 1.0% 25 20% 11.90% 7.8% 562.5% 11.4% 3.60% 398.4% 70.8% -1.8%-1006 214% 18% 2888 49.4% 51.9% 8.7% 57.5% 311% 317.7% 694.6% H 21.0% Current Liabiti Long tor Debt Other Noncurrent Liables Owners' Total Equities 7.8% 35% 14% 85% 21 % 327 6.3% 5.5% 271 13.2% 14.7% 14.2% 33.9% 76.0% 22.3% 8.7% 4.9% 15.6% 10.3% 46.9% 35.1% 11.6% 0.0 264% 79.9% 15.3% 43.6% 125% 3.3% 18.09 10.8% 12.9% 50% 41 4% 524% 79.3% 84.9% 112.2% 114.8% 87 19 203.9% 30.4% 437.5% 43% 214% 126 0% 196.1% 7.8% 8.4% 23.1% 12.2% 245% 775% 1382 48 123.7% 3112% 317.7% 694.6% 402% 76.1% (12) (13) 100.0% 100.0% 100.0% M.60% 57.00% 21.00% 0.00% 10.20% 14.00 3.40% 10.10% 47.30% Income Statement for Year Sales Cost of goods sold in depreciation of Operating. But Deprecation interest Advertising Research and Development Income Taxes Al Othernet Total Expenses Net Income Cash Flow from Operations Capital Expenditures (1) (2) (3) (4) 15) 100.0% 100.0% 100.0% 100.0% 100.0% 76.9% 748N 62.0% 14 0.1% 4.1% 30% 0.8% 04 1.9 07 0.8% 0.5% 36% 0.5 80 3.5% 7.75 11 45% 5.5% 2.0% 15.5% -0.7 72% 13.4 0.5 98.9% 63.6% 94.8% 93.3% 95.4% 1.14 36.4% 5.2% 6.7% 46% 1.22 2.95% 1.17% 1.09% Company Numbers 16) (7) (8) (9) (10) 100.0% 100.0% 100.0% 100.0% 100.0% 72.1% 26.60% 10% 19.60% 2.6% 20% 4.20N 0.00% 2.60% 1.3N 20% 110N 100% 3.3 400N 11. 20% 2.9% 6.6% 9.90 4.10 30% 13.5 22.5% 25.10% 6.40 -1.30% 95.7% 91.8% 62.1% 96.8% 16.0% 43% 8.2% 17.9% 3.2% 4ON 1.09% 5.20% 1.36% 3.06% 7.00 2.50 8209 120% 5.SON 10.8% 70% 192 44.80% 0.95% 90.9% 9.15 0.50% Effective financial statement analysis requires an understanding of the economic characteristics of the firm being analyzed. Many of these economic characteristics are captured in the relationship between various financial statement items. The exhibit presents condensed financial statement information for firms in 13 different industries. Balance sheet and income statements items are expressed as a percentage of total revenues (that is, all amounts are divided by total revenues for the year). The 13 companies (all corporations except the professional basketball franchise) shown represent the following industries: A. Advertising agency B. Aerospace manufacturer (significant government contracts) C. Beer brewery D. Computer manufacturer E. Department store chain F. Distiller of hard liquor G. Electric utility H. Finance company (also involved in leasing) 1. Grocery store chain J. Life insurance company K. Pharmaceutical company L. Professional basketball franchise (a partnership) M. Steel manufacture Use whatever clues that you can to match the companies in the exhibit with the industries listed above. Exhibit - Data for Ratio Detective Exercise (2) 19.1% 45% TE Balance Sheet at End of Year Cash and Marketable Securities Current Receivables Inventories Property. Plant, and Equipment Cost Accumulated Depreciation Net Other Assets Total Assets (1) 0.7% 02% 7.5% 17.0% -5.5% 11.5% 1.40% 11 0.8% .1% 0.1% 23 20% 47% (3) 9.0% 16.3% 11.9% 42.90% -21.0% 21.9% 12.50% 71.8% Company Numbers 15) 7) (8) 1.6% 44% 22.7% 36.2% 13.5% 21.3% 14.4% 21.7% 13.0% 37.50% 25 30% 65.90% -120% -11.8% -274% 25.5% 13.5% 38.5% 2.20% 31.50% 16.7% 79.9% 84.9% 112.2% 14) (5) 0.9% 11.9% 4.94 152% 5.6% 13.2% 79.40% 54% -217% -26.9% 57.7% 27.1% 6.90% 8.70% 76.0% 76.1% (9) (10) 5.1% 144% 13.2% 70.5% 10.5% 75% 1625% 18.40 -80.5% 93% 820% 9.1% 40% 22.1% 114.8% 123.7% (11) (12) (13) 245.6% 1.0% 25 20% 11.90% 7.8% 562.5% 11.4% 3.60% 398.4% 70.8% -1.8%-1006 214% 18% 2888 49.4% 51.9% 8.7% 57.5% 311% 317.7% 694.6% H 21.0% Current Liabiti Long tor Debt Other Noncurrent Liables Owners' Total Equities 7.8% 35% 14% 85% 21 % 327 6.3% 5.5% 271 13.2% 14.7% 14.2% 33.9% 76.0% 22.3% 8.7% 4.9% 15.6% 10.3% 46.9% 35.1% 11.6% 0.0 264% 79.9% 15.3% 43.6% 125% 3.3% 18.09 10.8% 12.9% 50% 41 4% 524% 79.3% 84.9% 112.2% 114.8% 87 19 203.9% 30.4% 437.5% 43% 214% 126 0% 196.1% 7.8% 8.4% 23.1% 12.2% 245% 775% 1382 48 123.7% 3112% 317.7% 694.6% 402% 76.1% (12) (13) 100.0% 100.0% 100.0% M.60% 57.00% 21.00% 0.00% 10.20% 14.00 3.40% 10.10% 47.30% Income Statement for Year Sales Cost of goods sold in depreciation of Operating. But Deprecation interest Advertising Research and Development Income Taxes Al Othernet Total Expenses Net Income Cash Flow from Operations Capital Expenditures (1) (2) (3) (4) 15) 100.0% 100.0% 100.0% 100.0% 100.0% 76.9% 748N 62.0% 14 0.1% 4.1% 30% 0.8% 04 1.9 07 0.8% 0.5% 36% 0.5 80 3.5% 7.75 11 45% 5.5% 2.0% 15.5% -0.7 72% 13.4 0.5 98.9% 63.6% 94.8% 93.3% 95.4% 1.14 36.4% 5.2% 6.7% 46% 1.22 2.95% 1.17% 1.09% Company Numbers 16) (7) (8) (9) (10) 100.0% 100.0% 100.0% 100.0% 100.0% 72.1% 26.60% 10% 19.60% 2.6% 20% 4.20N 0.00% 2.60% 1.3N 20% 110N 100% 3.3 400N 11. 20% 2.9% 6.6% 9.90 4.10 30% 13.5 22.5% 25.10% 6.40 -1.30% 95.7% 91.8% 62.1% 96.8% 16.0% 43% 8.2% 17.9% 3.2% 4ON 1.09% 5.20% 1.36% 3.06% 7.00 2.50 8209 120% 5.SON 10.8% 70% 192 44.80% 0.95% 90.9% 9.15 0.50%