Answered step by step
Verified Expert Solution
Question
1 Approved Answer
Efficiency Ratio: Asset Turnover Ratio Inventory Turnover Ratio Receivables Turnover Ratio Accounts Payable Turnover Ratio 54/ 170 CONSOLIDATED STATEMENT OF CASH FLOWS For the year


Efficiency Ratio: Asset Turnover Ratio Inventory Turnover Ratio Receivables Turnover Ratio Accounts Payable Turnover Ratio
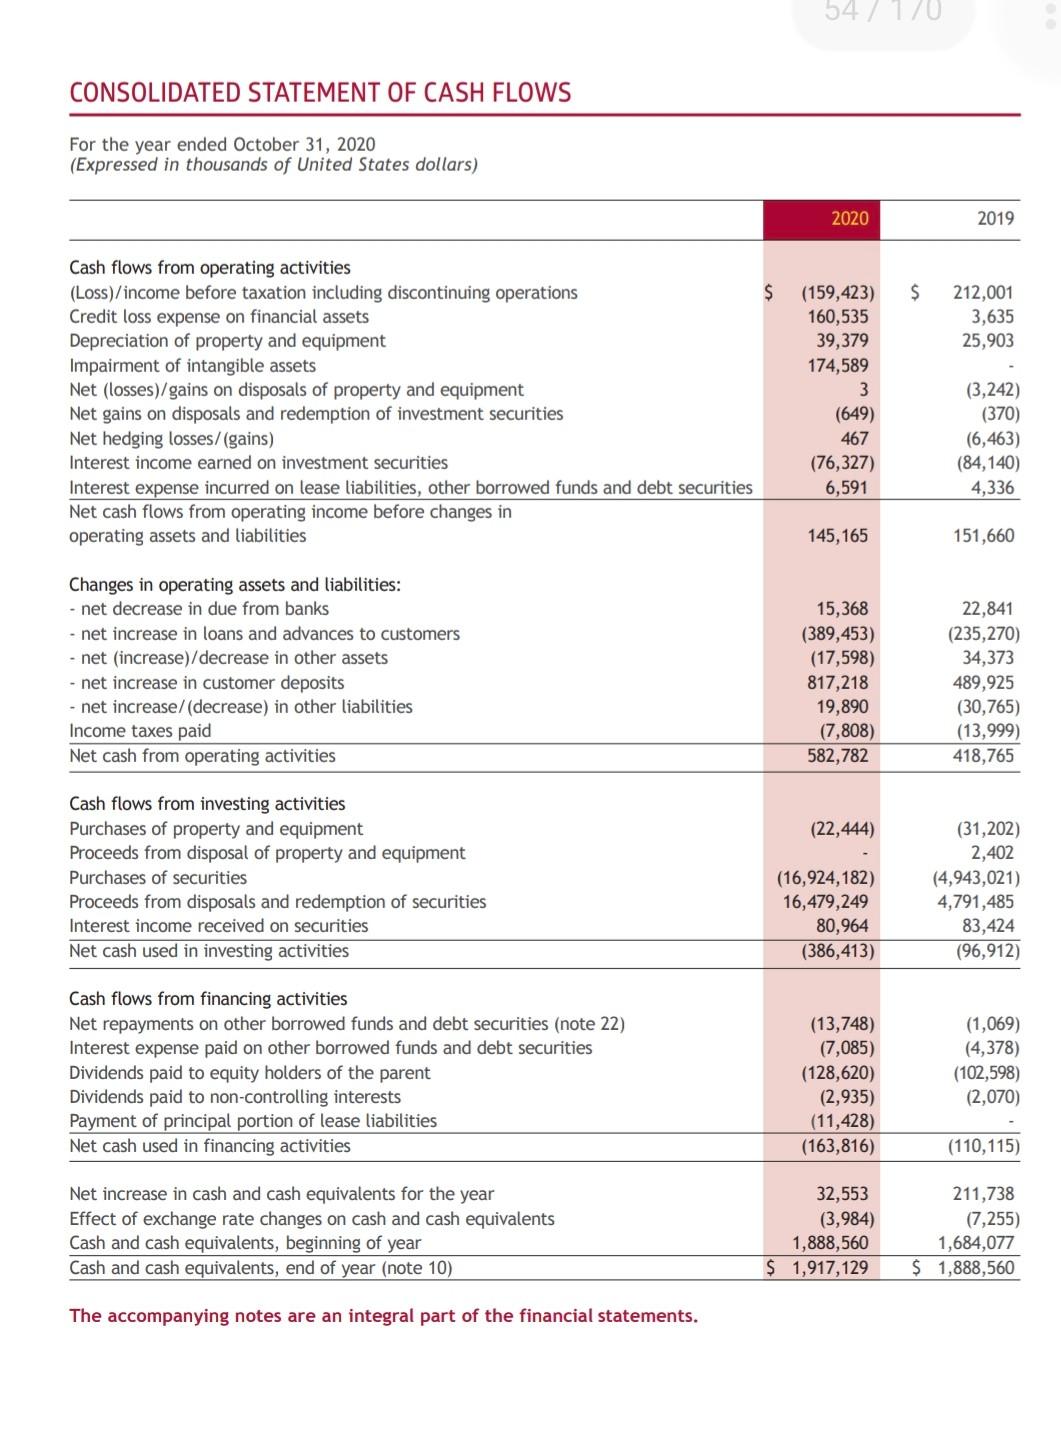
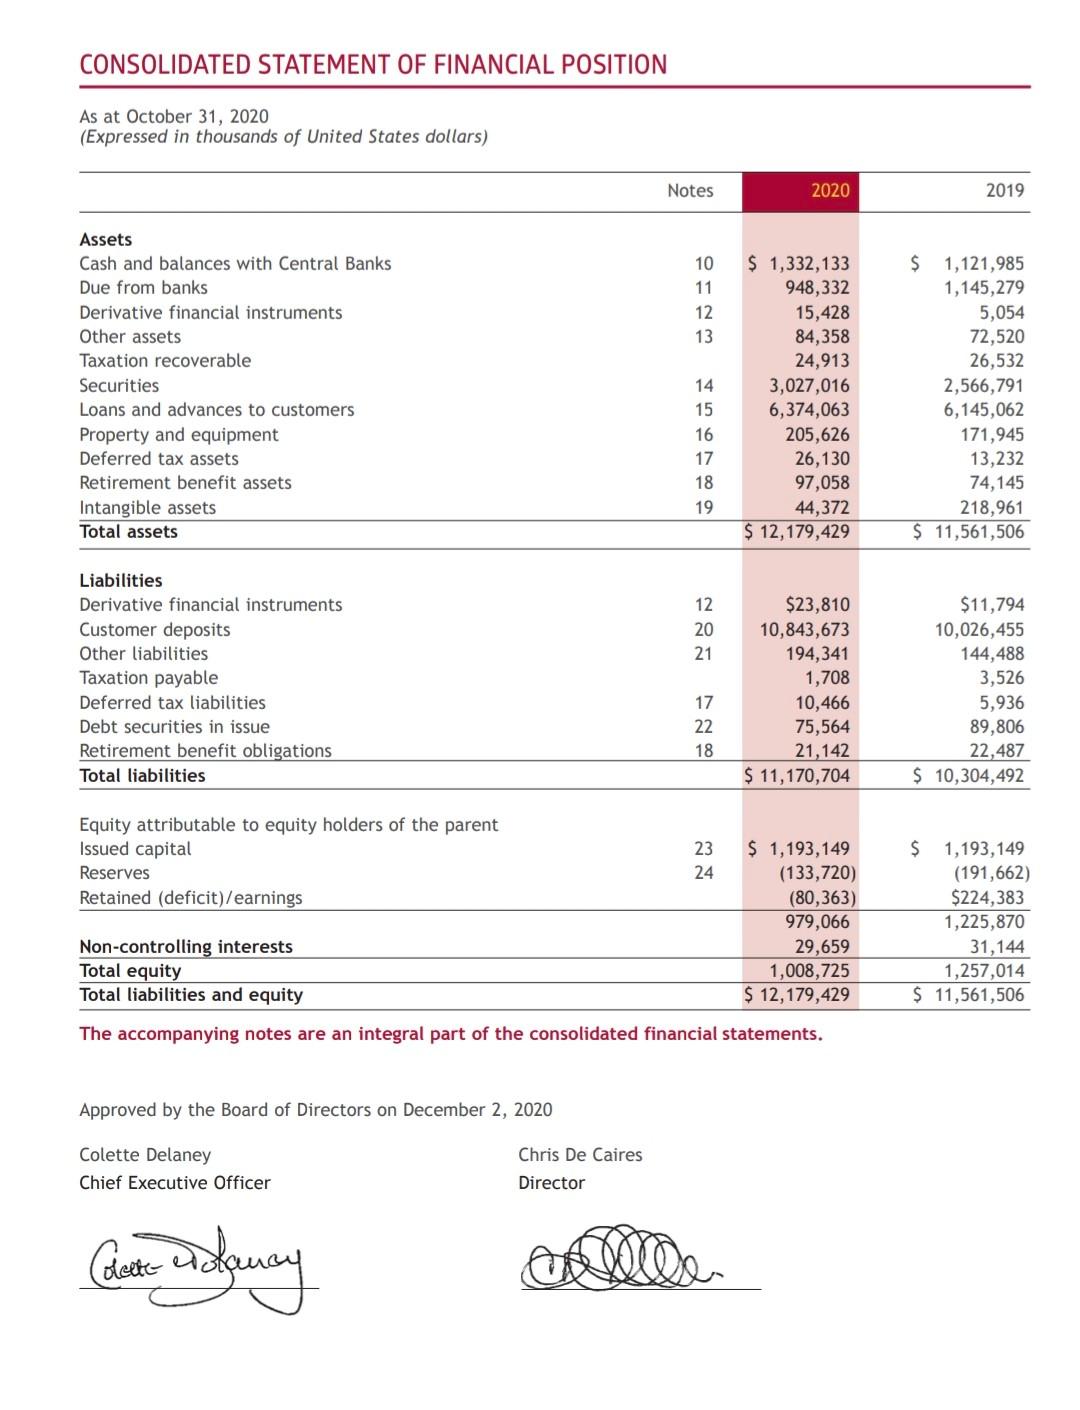
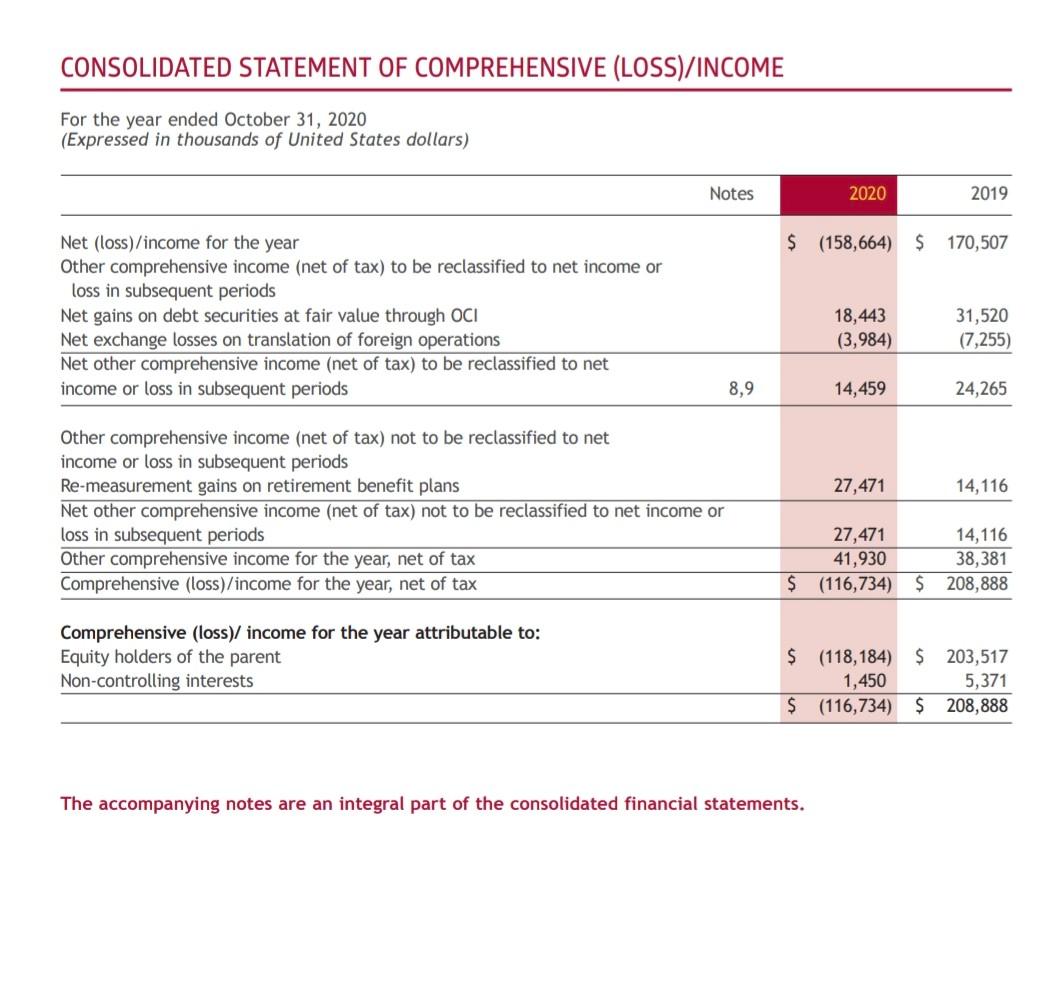
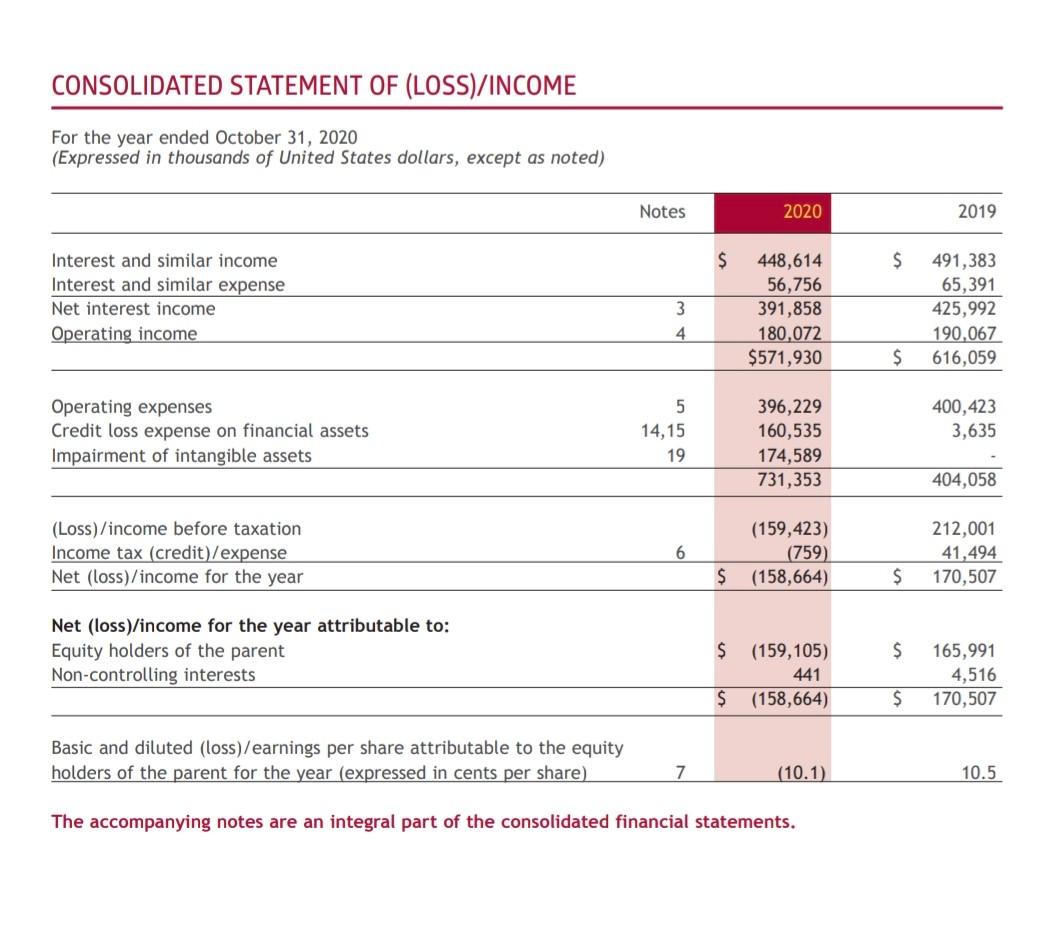
54/ 170 CONSOLIDATED STATEMENT OF CASH FLOWS For the year ended October 31, 2020 (Expressed in thousands of United States dollars) 2020 2019 $ $ 212,001 3,635 25,903 Cash flows from operating activities (Loss)/income before taxation including discontinuing operations Credit loss expense on financial assets Depreciation of property and equipment Impairment of intangible assets Net (losses)/gains on disposals of property and equipment Net gains on disposals and redemption of investment securities Net hedging losses/(gains) Interest income earned on investment securities Interest expense incurred on lease liabilities, other borrowed funds and debt securities Net cash flows from operating income before changes in operating assets and liabilities (159,423) 160,535 39,379 174,589 3 (649) 467 (76,327) 6,591 (3,242) (370) (6,463) (84,140) 4,336 145,165 151,660 Changes in operating assets and liabilities: net decrease in due from banks - net increase in loans and advances to customers net (increase)/decrease in other assets - net increase in customer deposits net increase/(decrease) in other liabilities Income taxes paid Net cash from operating activities 15,368 (389,453) (17,598) 817,218 19,890 (7,808) 582,782 22,841 (235,270) 34,373 489,925 (30,765) (13,999) 418,765 (22,444) Cash flows from investing activities Purchases of property and equipment Proceeds from disposal of property and equipment Purchases of securities Proceeds from disposals and redemption of securities Interest income received on securities Net cash used in investing activities (16,924,182) 16,479,249 80,964 (386,413) (31,202) 2,402 (4,943,021) 4,791,485 83,424 (96,912) Cash flows from financing activities Net repayments on other borrowed funds and debt securities (note 22) Interest expense paid on other borrowed funds and debt securities Dividends paid to equity holders of the parent Dividends paid to non-controlling interests Payment of principal portion of lease liabilities Net cash used in financing activities (13,748) (7,085) (128,620) (2,935) (11,428) (163,816) (1,069) (4,378) (102,598) (2,070) (110,115) Net increase in cash and cash equivalents for the year Effect of exchange rate changes on cash and cash equivalents Cash and cash equivalents, beginning of year Cash and cash equivalents, end of year (note 10) 32,553 (3,984) 1,888,560 $ 1,917,129 211,738 (7,255) 1,684,077 $ 1,888,560 The accompanying notes are an integral part of the financial statements. CONSOLIDATED STATEMENT OF FINANCIAL POSITION As at October 31, 2020 (Expressed in thousands of United States dollars) Notes 2020 2019 10 11 12 13 Assets Cash and balances with Central Banks Due from banks Derivative financial instruments Other assets Taxation recoverable Securities Loans and advances to customers Property and equipment Deferred tax assets Retirement benefit assets Intangible assets Total assets 14 15 $ 1,332,133 948,332 15,428 84,358 24,913 3,027,016 6,374,063 205,626 26,130 97,058 44,372 $ 12,179,429 $ 1,121,985 1,145,279 5,054 72,520 26,532 2,566,791 6,145,062 171,945 13,232 74,145 218,961 $ 11,561,506 16 17 18 19 12 20 21 Liabilities Derivative financial instruments Customer deposits Other liabilities Taxation payable Deferred tax liabilities Debt securities in issue Retirement benefit obligations Total liabilities $23,810 10,843,673 194,341 1,708 10,466 75,564 21,142 $ 11,170,704 $11,794 10,026,455 144,488 3,526 5,936 89,806 22,487 $ 10,304,492 17 22 18 Equity attributable to equity holders of the parent Issued capital Reserves Retained (deficit)/earnings 23 24 $ 1,193,149 (133,720) (80,363) 979,066 29,659 1,008,725 $ 12,179,429 $ 1,193,149 (191,662) $224,383 1,225,870 31,144 1,257,014 $ 11,561,506 Non-controlling interests Total equity Total liabilities and equity The accompanying notes are an integral part of the consolidated financial statements. Approved by the Board of Directors on December 2, 2020 Colette Delaney Chief Executive Officer Chris De Caires Director (date dancy CONSOLIDATED STATEMENT OF COMPREHENSIVE (LOSS)/INCOME For the year ended October 31, 2020 (Expressed in thousands of United States dollars) Notes 2020 2019 $ (158,664) $ 170,507 Net (loss) /income for the year Other comprehensive income (net of tax) to be reclassified to net income or loss in subsequent periods Net gains on debt securities at fair value through OCI Net exchange losses on translation of foreign operations Net other comprehensive income (net of tax) to be reclassified to net income or loss in subsequent periods 18,443 (3,984) 31,520 (7,255) 8,9 14,459 24,265 27,471 14,116 Other comprehensive income (net of tax) not to be reclassified to net income loss in Re- measurement gains on retirement benefit plans Net other comprehensive income (net of tax) not to be reclassified to net income or loss in subsequent periods Other comprehensive income for the year, net of tax Comprehensive (loss)/income for the year, net of tax 27,471 41,930 (116,734) 14,116 38,381 208,888 $ $ Comprehensive (loss)/ income for the year attributable to: Equity holders of the parent Non-controlling interests $ (118,184) 1,450 $ (116,734) $ 203,517 5,371 $ 208,888 The accompanying notes are an integral part of the consolidated financial statements. CONSOLIDATED STATEMENT OF (LOSS)/INCOME For the year ended October 31, 2020 (Expressed in thousands of United States dollars, except as noted) Notes 2020 2019 $ $ Interest and similar income Interest and similar expense Net interest income Operating income 3 448,614 56,756 391,858 180,072 $571,930 491,383 65,391 425,992 190,067 616,059 4 $ Operating expenses Credit loss expense on financial assets Impairment of intangible assets 5 14,15 19 400,423 3,635 396,229 160,535 174,589 731,353 404,058 (Loss)/income before taxation Income tax (credit)/expense Net (Loss)/income for the year 6 (159,423) (759) (158,664) 212,001 41,494 170,507 $ $ Net (loss)/income for the year attributable to: Equity holders of the parent Non-controlling interests $ $ (159,105) 441 (158,664) 165,991 4,516 170,507 $ $ Basic and diluted (loss)/earnings per share attributable to the equity holders of the parent for the year (expressed in cents per share) 7 (10.1) 10.5 The accompanying notes are an integral part of the consolidated financial statementsStep by Step Solution
There are 3 Steps involved in it
Step: 1

Get Instant Access to Expert-Tailored Solutions
See step-by-step solutions with expert insights and AI powered tools for academic success
Step: 2

Step: 3

Ace Your Homework with AI
Get the answers you need in no time with our AI-driven, step-by-step assistance
Get Started


