Elaborate Pie Chart Bar Graph Energy Simulation (? speed To explore the conservation of energy, you will use a T simulated skate park and skateboarder.
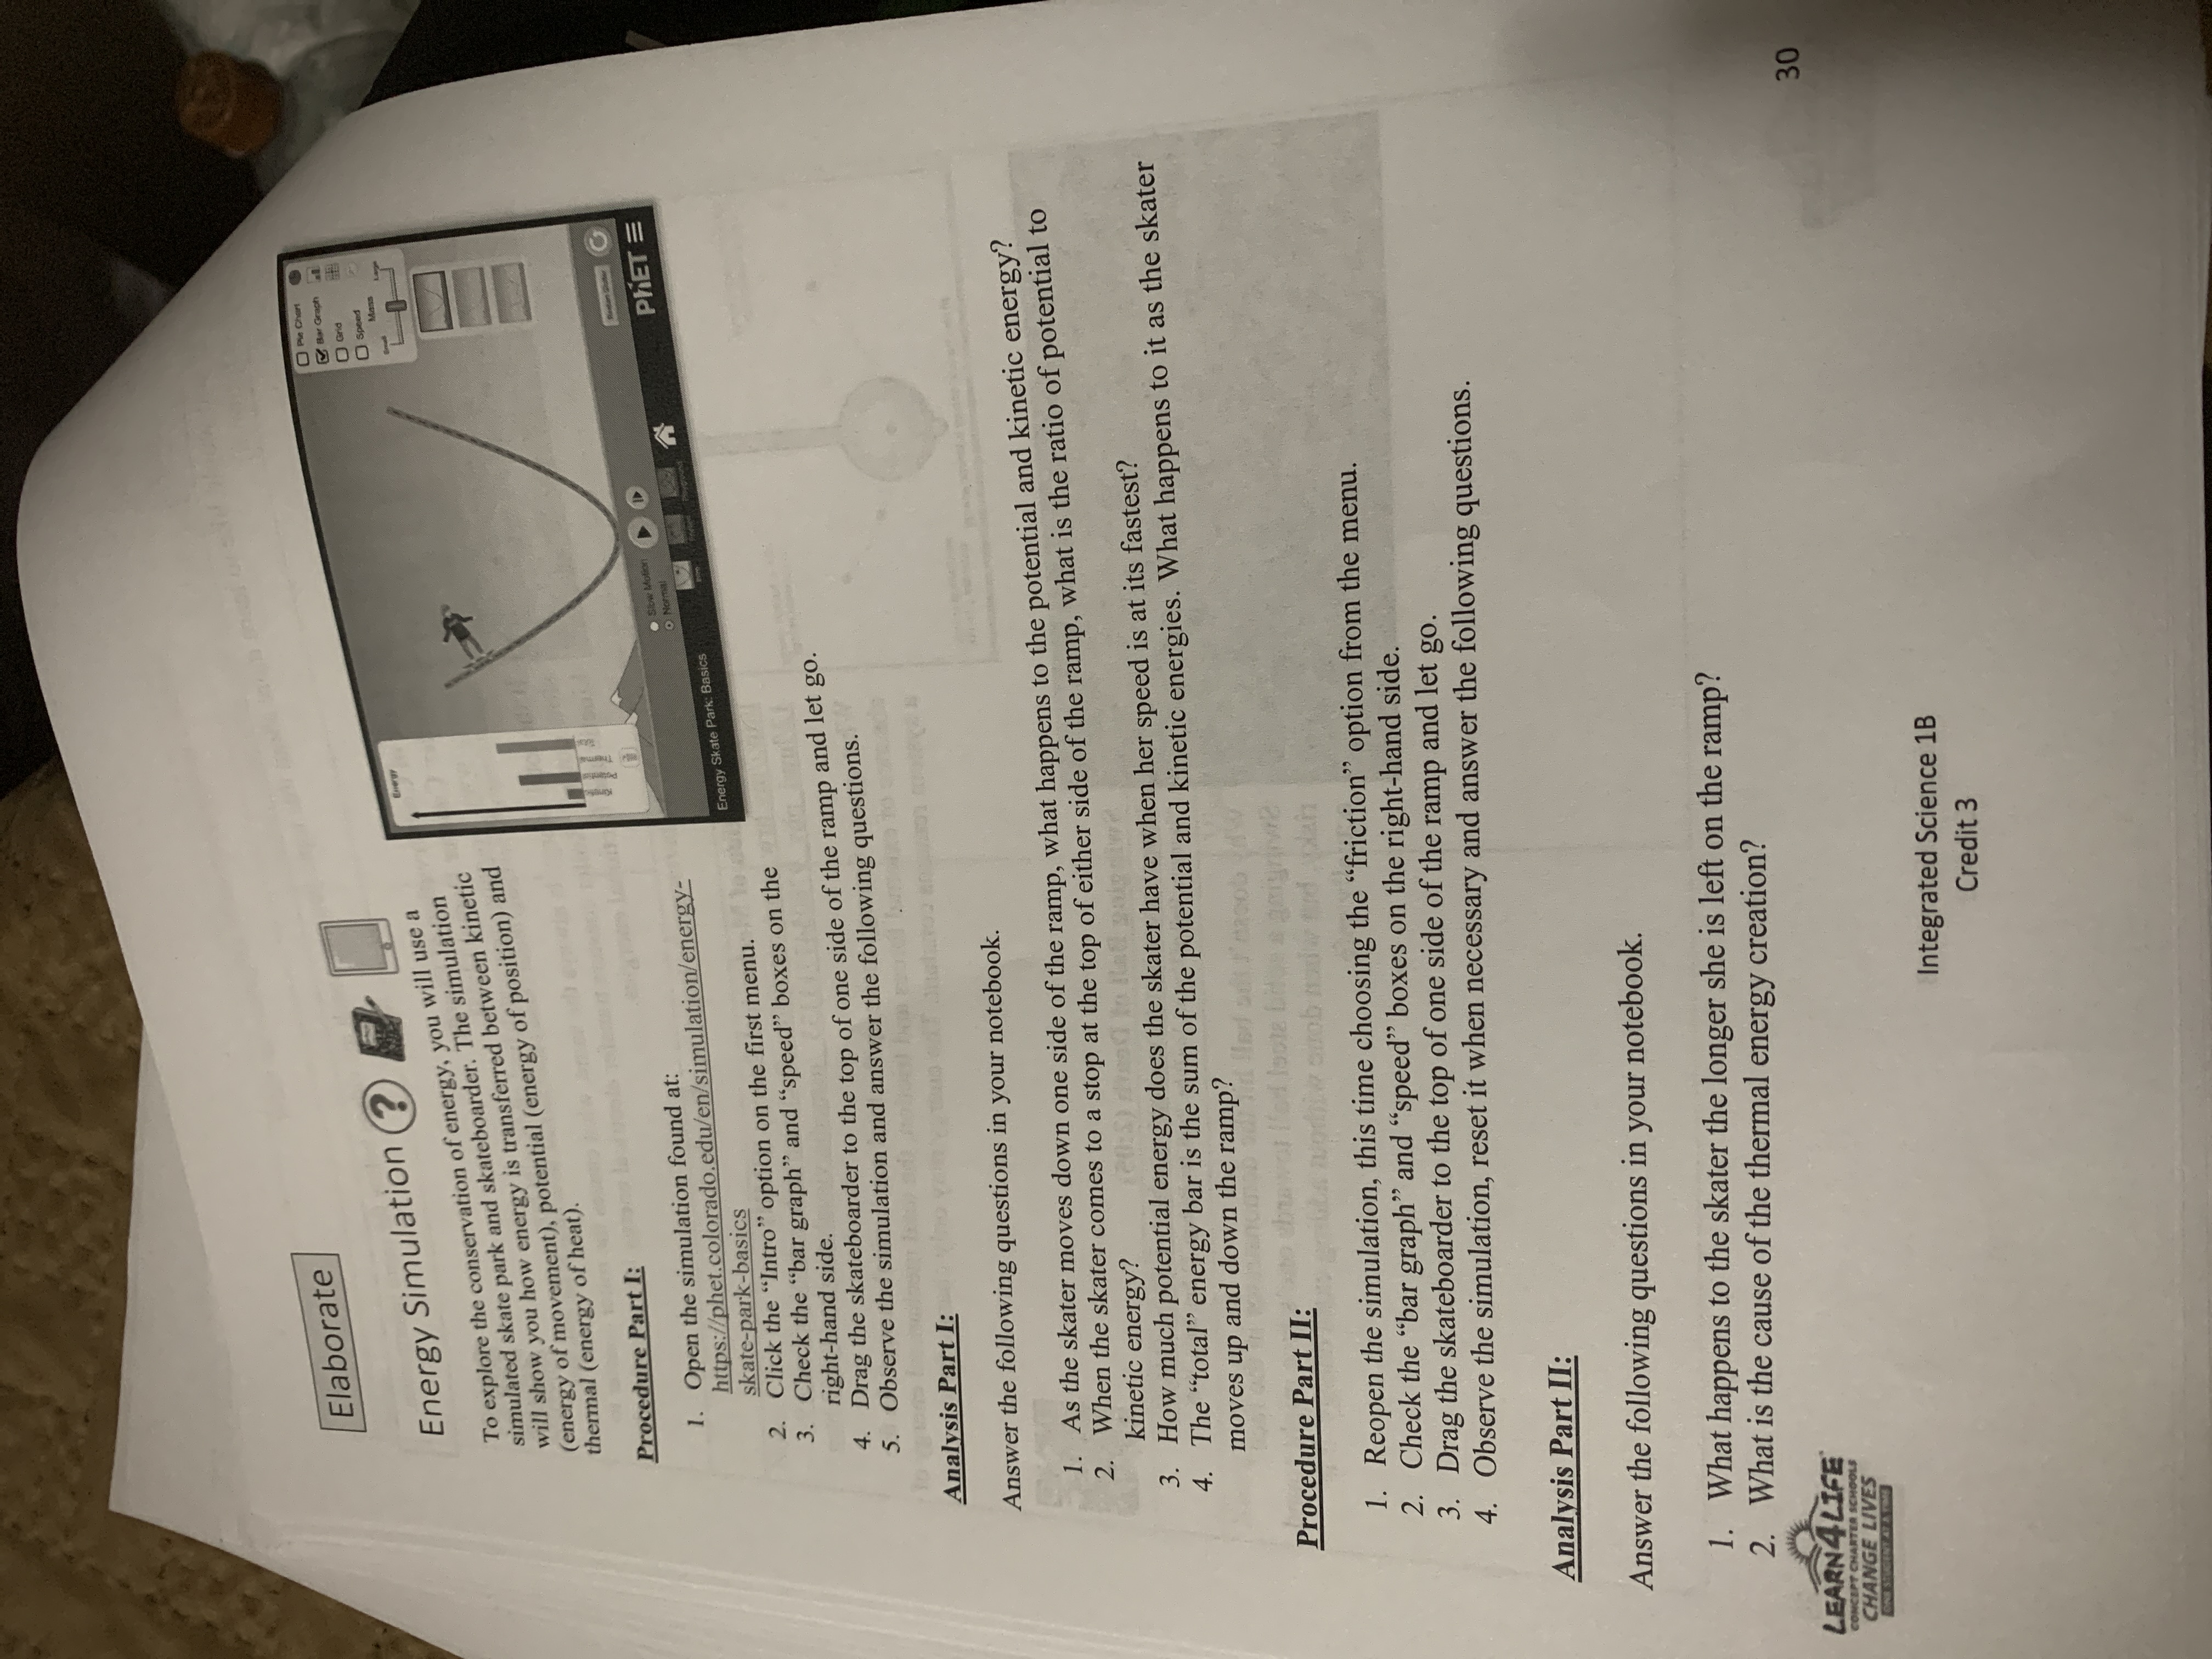
Elaborate Pie Chart Bar Graph Energy Simulation (? speed To explore the conservation of energy, you will use a T simulated skate park and skateboarder. The simulation will show you how energy is transferred between kinetic (energy of movement), potential (energy of position) and thermal (energy of heat). Procedure Part I: 1. Open the simulation found at: . Sow MORON I https://phet.colorado.edu/en/simulation/energy- PhET = skate-park-basics Energy Skate Park : Basics 12. Click the "Intro" option on the first menu. 3. Check the "bar graph" and "speed" boxes on the right-hand side. 4. Drag the skateboarder to the top of one side of the ramp and let go. 5. Observe the simulation and answer the following questions. Analysis Part I: Answer the following questions in your notebook. 1. As the skater moves down one side of the ramp, what happens to the potential and kinetic energy? 2. When the skater comes to a stop at the top of either side of the ramp, what is the ratio of potential to kinetic energy? 3. How much potential energy does the skater have when her speed is at its fastest? 4. The "total" energy bar is the sum of the potential and kinetic energies. What happens to it as the skater moves up and down the ramp? Procedure Part II: 1. Reopen the simulation, this time choosing the "friction" option from the menu. 2. Check the "bar graph" and "speed" boxes on the right-hand side. 3. Drag the skateboarder to the top of one side of the ramp and let go. 4. Observe the simulation, reset it when necessary and answer the following questions. Analysis Part II: Answer the following questions in your notebook. 1. What happens to the skater the longer she is left on the ramp? 2. What is the cause of the thermal energy creation? LEARN4LIFE CHANGE LIVES 30 Integrated Science 1B Credit 313. Once the skater comes to a stop, what has happened to all of the original potential energy? 4. The "total" energy bar is the sum of all three energies. How does the total amount of energy when you first release the skater relate to the total amount once she has stopped? Procedure Part III: 1. Restart the simulation and choose the "playground" option. 2. Check the "bar graph" and "speed" boxes on the right-hand side. 3. Drag a piece of track from the bottom left onto the simulation. Multiple pieces can be connected end to end on the dotted circles. 4. Create a custom track of your choosing. Let your skater go at one end and observe multiple times. Analysis Part III: In your notebook, use a full page to sketch your track. On your sketch, label the following locations: . Where potential energy is the greatest. 2. Where kinetic energy is the greatest. 3 . Any points on the track where the potential energy is equal to kinetic energy. 4. The spot where your skater comes to a full stop. 5. The area of greatest friction (where you see thermal energy increase the fastest). HOO
Step by Step Solution
There are 3 Steps involved in it
Step: 1
Get Instant Access to Expert-Tailored Solutions
See step-by-step solutions with expert insights and AI powered tools for academic success
Step: 2
Step: 3
Ace Your Homework with AI
Get the answers you need in no time with our AI-driven, step-by-step assistance