Answered step by step
Verified Expert Solution
Link Copied!

Question

1 Approved Answer

Emphasis Heading 1 Heading 3 Se Replace Select- I Create and sh Adobe PDF Paragraph 2.1.3.4 Styles Adobe Editing 14 15 16 10.1.11 Question 1:
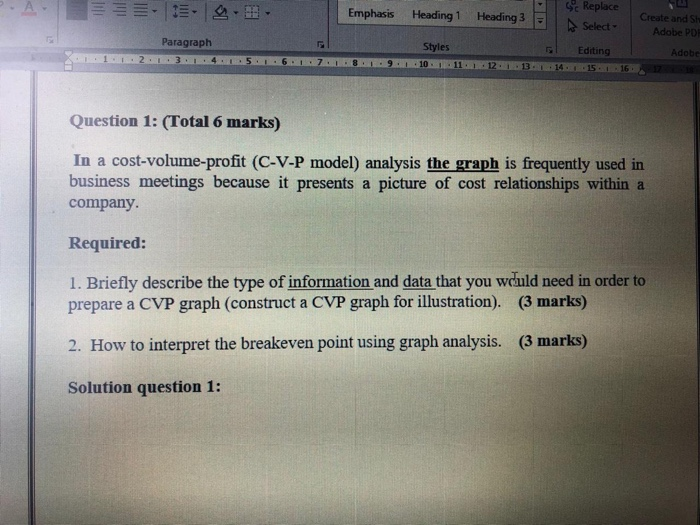
image text in transcribed
Emphasis Heading 1 Heading 3 Se Replace Select- I Create and sh Adobe PDF Paragraph 2.1.3.4 Styles Adobe Editing 14 15 16 10.1.11 Question 1: (Total 6 marks) In a cost-volume-profit (C-V-P model) analysis the graph is frequently used in business meetings because it presents a picture of cost relationships within a company. Required: 1. Briefly describe the type of information and data that you wduld need in order to prepare a CVP graph (construct a CVP graph for illustration). (3 marks) 2. How to interpret the breakeven point using graph analysis. (3 marks) Solution question 1

Step by Step Solution

There are 3 Steps involved in it

Step: 1

blur-text-image

Get Instant Access to Expert-Tailored Solutions

See step-by-step solutions with expert insights and AI powered tools for academic success

Step: 2

blur-text-image_2

Step: 3

blur-text-image_3

Ace Your Homework with AI

Get the answers you need in no time with our AI-driven, step-by-step assistance

Get Started

Recommended Textbook for

The Customer Base Audit The First Step On The Journey To Customer Centricity

Authors: Peter Fader, Bruce G.S. Hardie, Michael Ross

1st Edition

1613631618, 978-1613631614

More Books

Students also viewed these Accounting questions