

Answered step by step
Verified Expert Solution
Question
1 Approved Answer
End of Chapter: Performance Evaluation A10-66. Analyzing segment margins reports (Learning Objective 3) REAL LIFE The Procter & Gamble Company (P&G), a global consumer
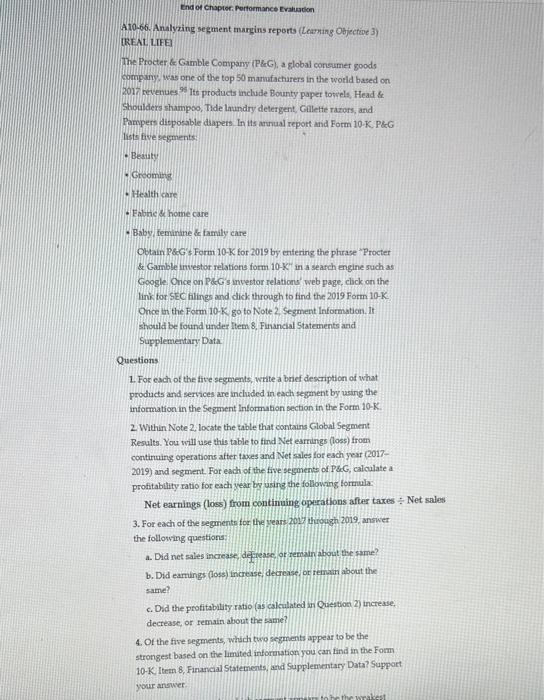
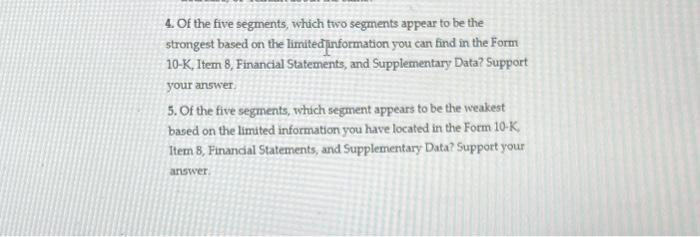
End of Chapter: Performance Evaluation A10-66. Analyzing segment margins reports (Learning Objective 3) REAL LIFE The Procter & Gamble Company (P&G), a global consumer goods company, was one of the top 50 manufacturers in the world based on 2017 revenues. Its products include Bounty paper towels, Head & Shoulders shampoo, Tide laundry detergent, Gillette razors, and Pampers disposable diapers. In its annual report and Form 10-K, P&G lists five segments: Beauty Grooming Health care Fabric & home care Baby, feminine & family care Obtain P&G's Form 10-K for 2019 by entering the phrase "Procter & Gamble investor relations form 10-K" in a search engine such as Google. Once on P&G's investor relations' web page, click on the link for SEC filings and click through to find the 2019 Form 10-K Once in the Form 10-K, go to Note 2, Segment Information. It should be found under Item 8, Financial Statements and Supplementary Data Questions 1. For each of the five segments, write a brief description of what products and services are included in each segment by using the information in the Segment Information section in the Form 10-K 2. Within Note 2, locate the table that contains Global Segment Results. You will use this table to find Net earrings (loss) from continuing operations after taxes and Net sales for each year (2017- 2019) and segment. For each of the five segments of P&G, calculate a profitability ratio for each year by using the following formula: Net earnings (loss) from continuing operations after taxes Net sales 3. For each of the segments for the years 2017 through 2019, answer the following questions: a. Did net sales increase, decrease, or remain about the same? b. Did earnings (loss) increase, decrease, or remain about the same? c. Did the profitability ratio (as calculated in Question 2) increase, decrease, or remain about the same? 4. Of the five segments, which two segments appear to be the strongest based on the limited information you can find in the Form 10-K, Item 8, Financial Statements, and Supplementary Data? Support your answer. to be the weakest
Step by Step Solution
There are 3 Steps involved in it
Step: 1

Get Instant Access to Expert-Tailored Solutions
See step-by-step solutions with expert insights and AI powered tools for academic success
Step: 2

Step: 3
Ace Your Homework with AI
Get the answers you need in no time with our AI-driven, step-by-step assistance
Get Started
Survey of Accounting
Authors: Edmonds, old, Mcnair, Tsay
2nd edition
9780077392659, 978-0-07-73417, 77392655, 0-07-734177-5, 73379557, 978-0073379555