Engine_Size Horsepower
4.6 355
5.5 361
5.2 381
3.4 252
3.0 236
3.5 252
3.8 312
4.0 273
4.2 344
1.4 148
1.5 148
3.6 306
1.6 137
1.8 147
5.9 402
2.0 167
2.3 209
2.4 191
2.5 228
2.8 244
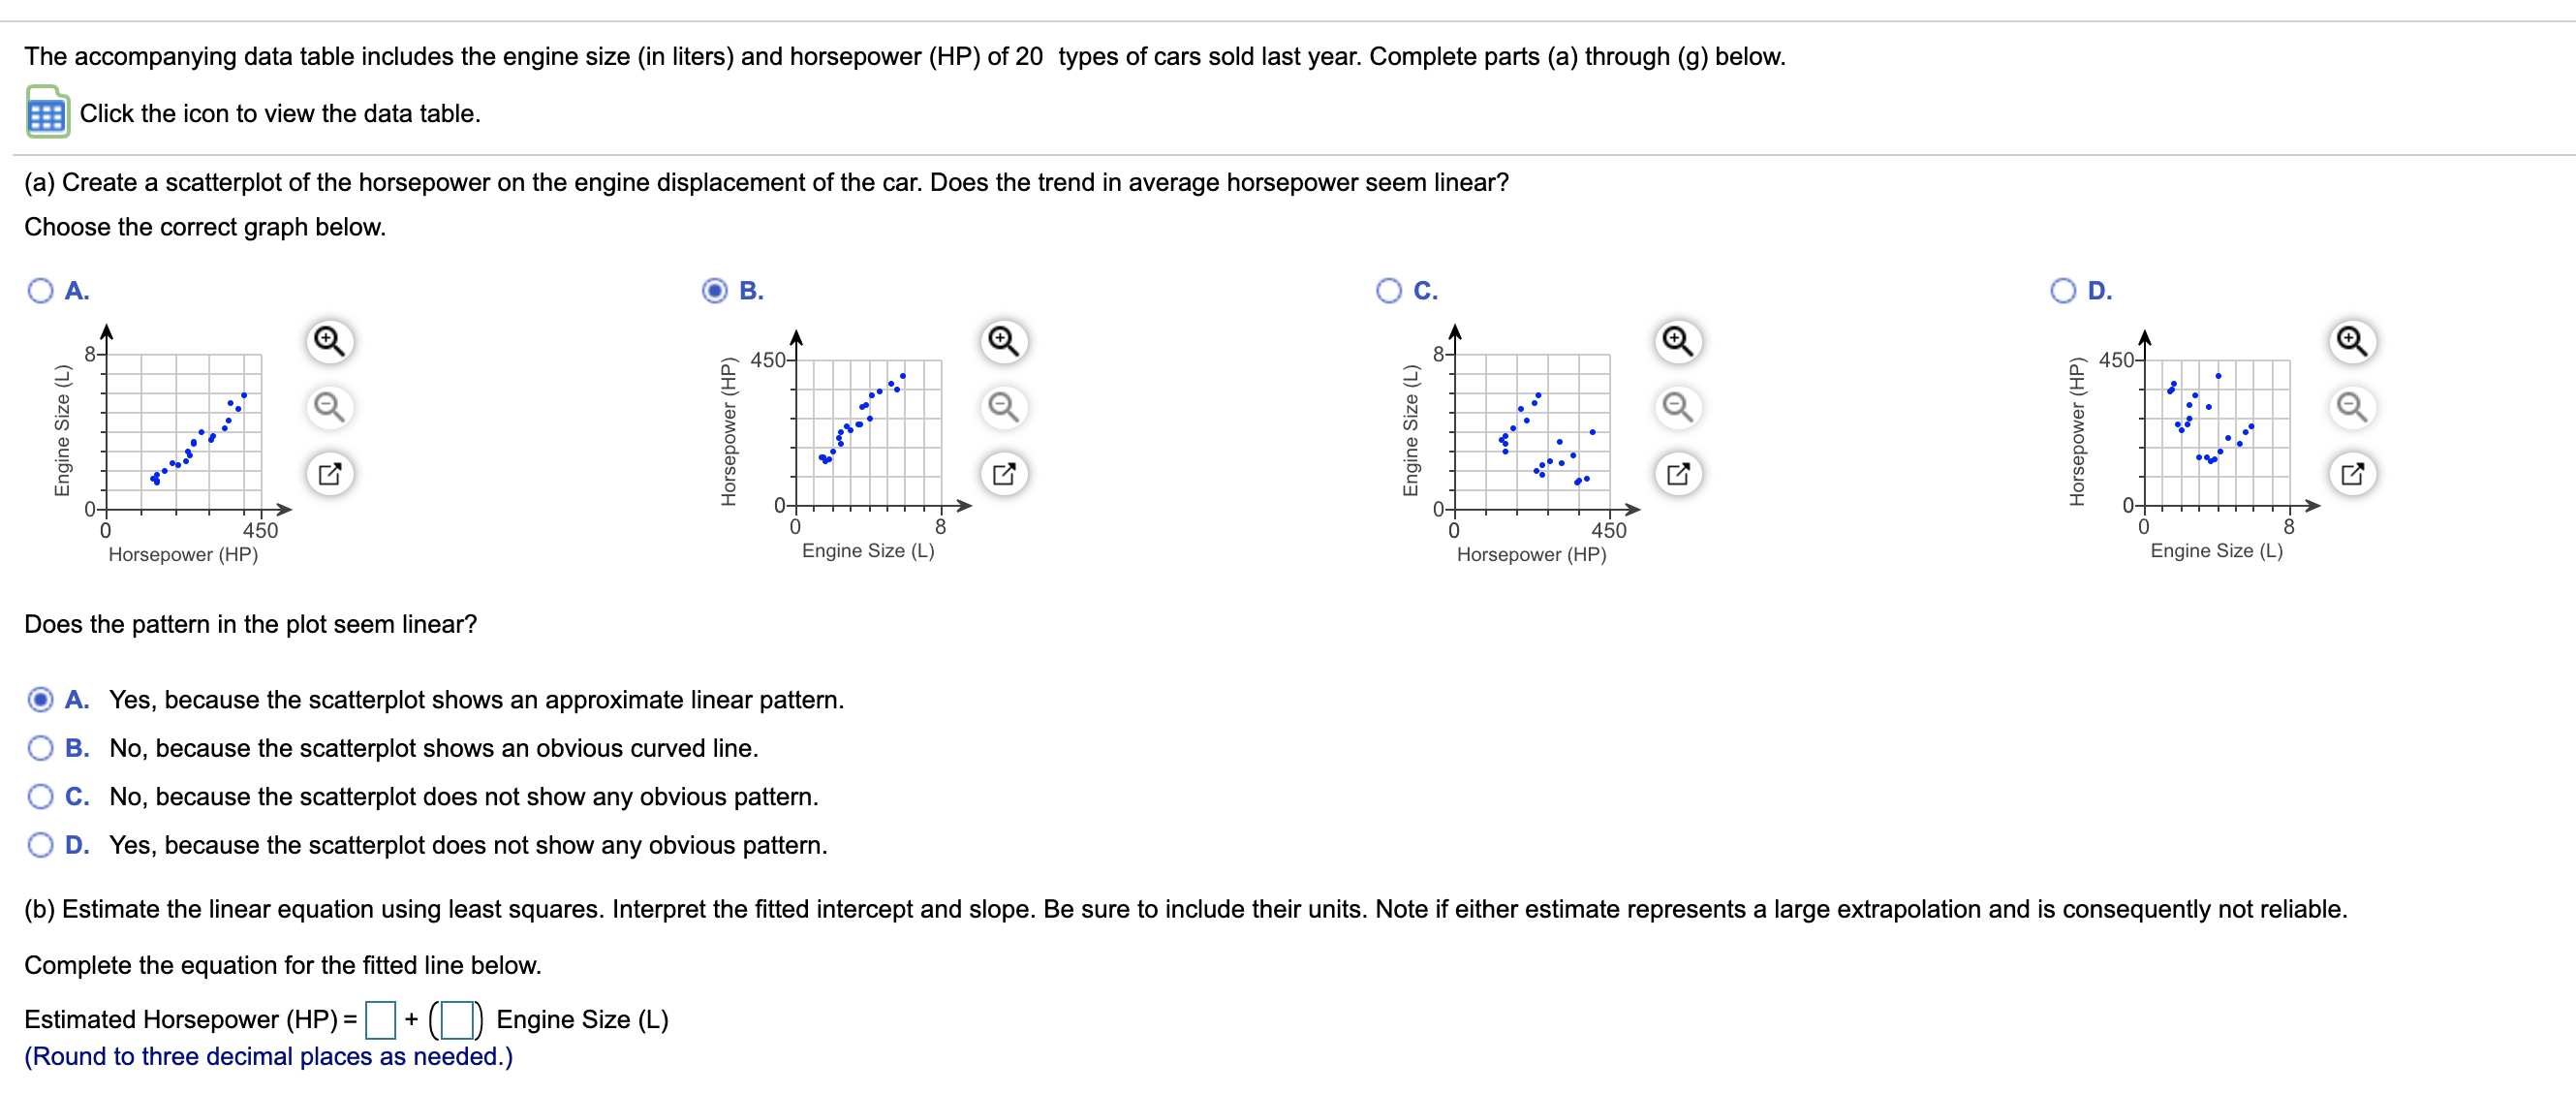
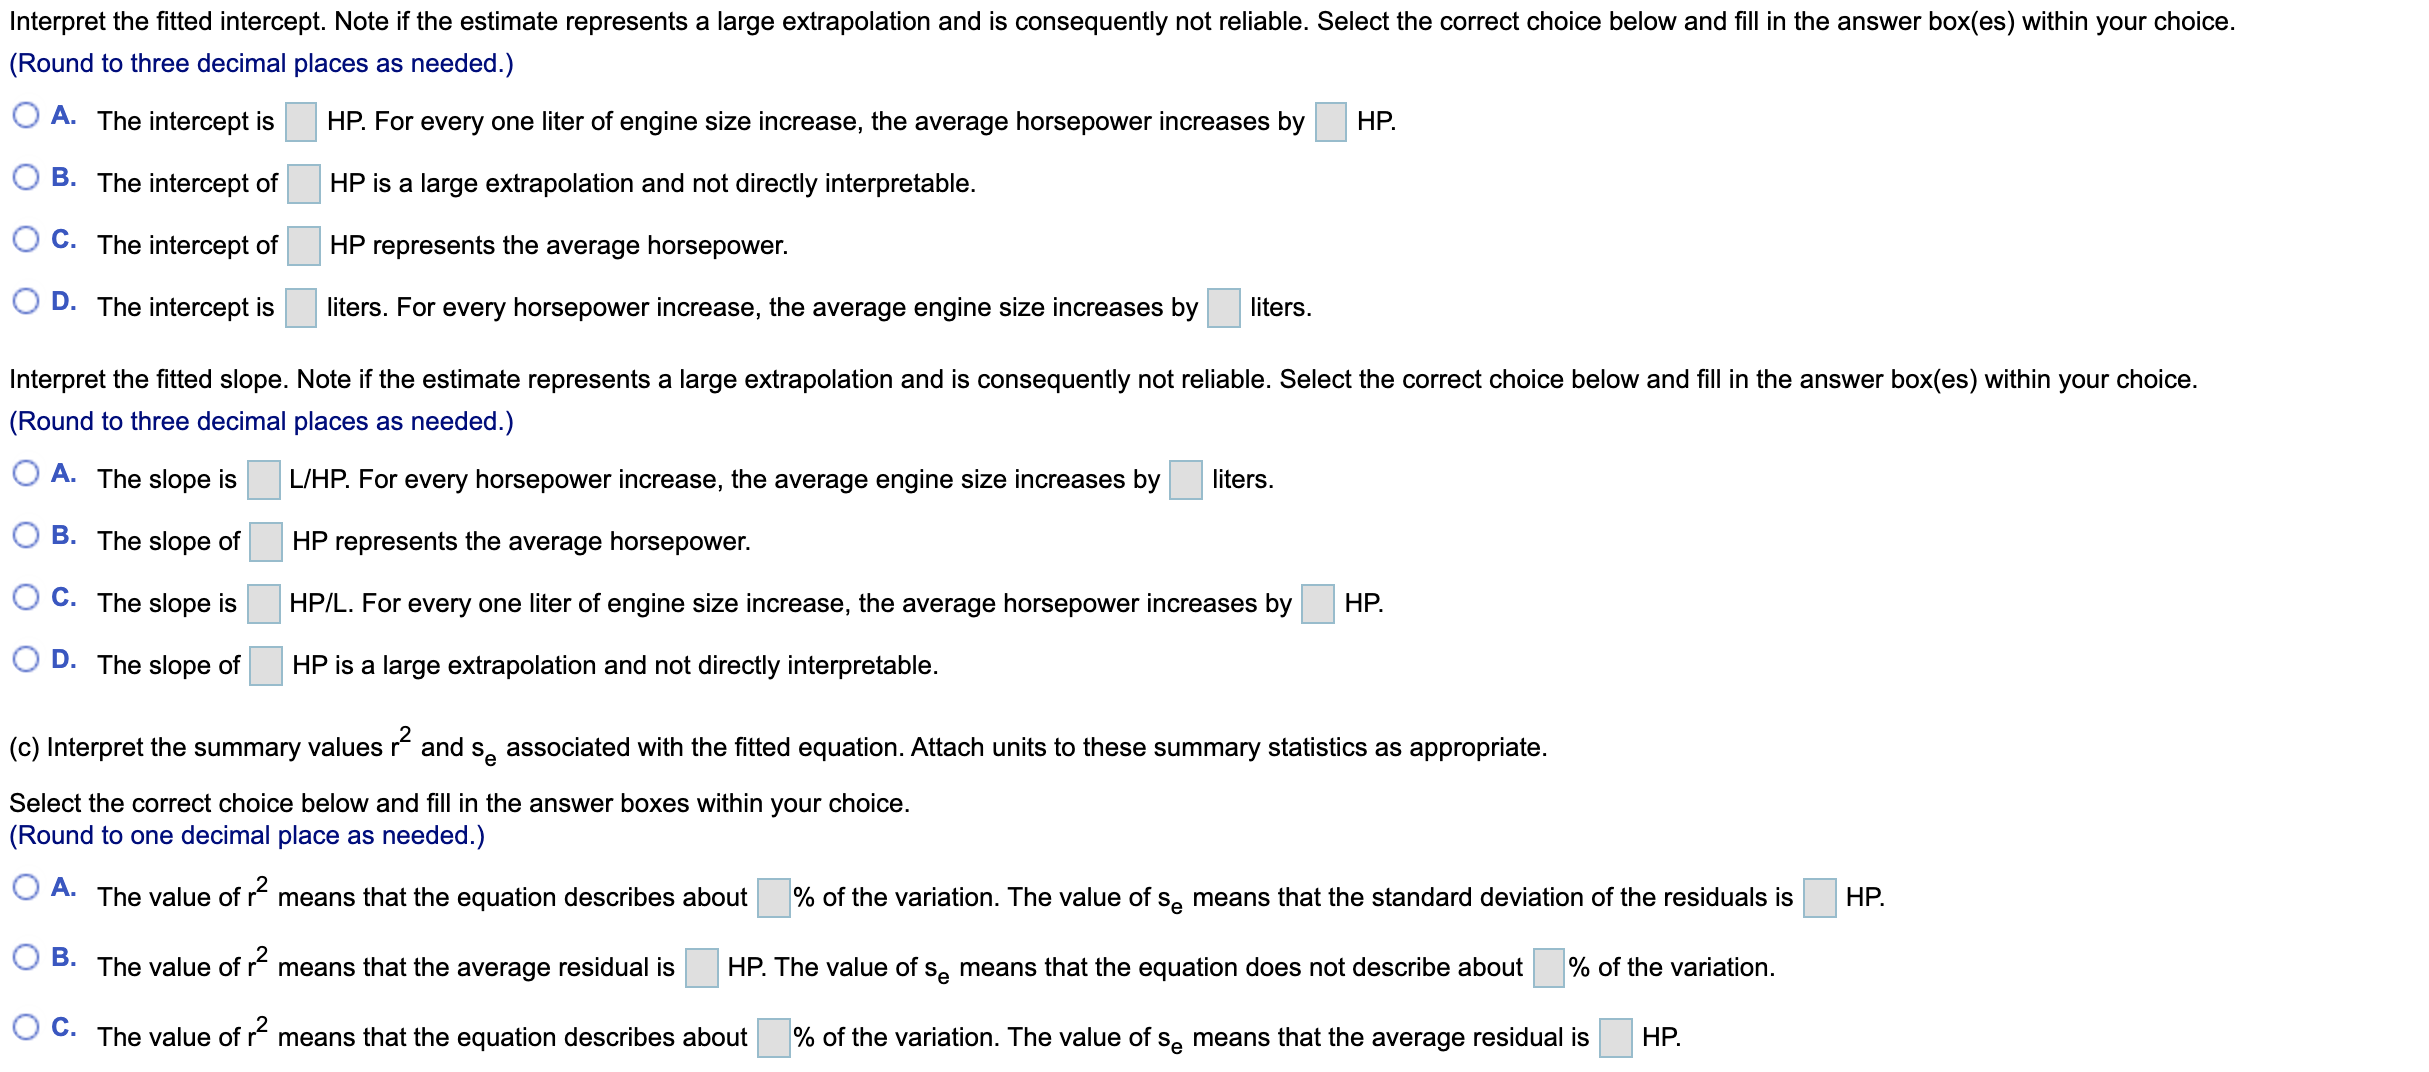
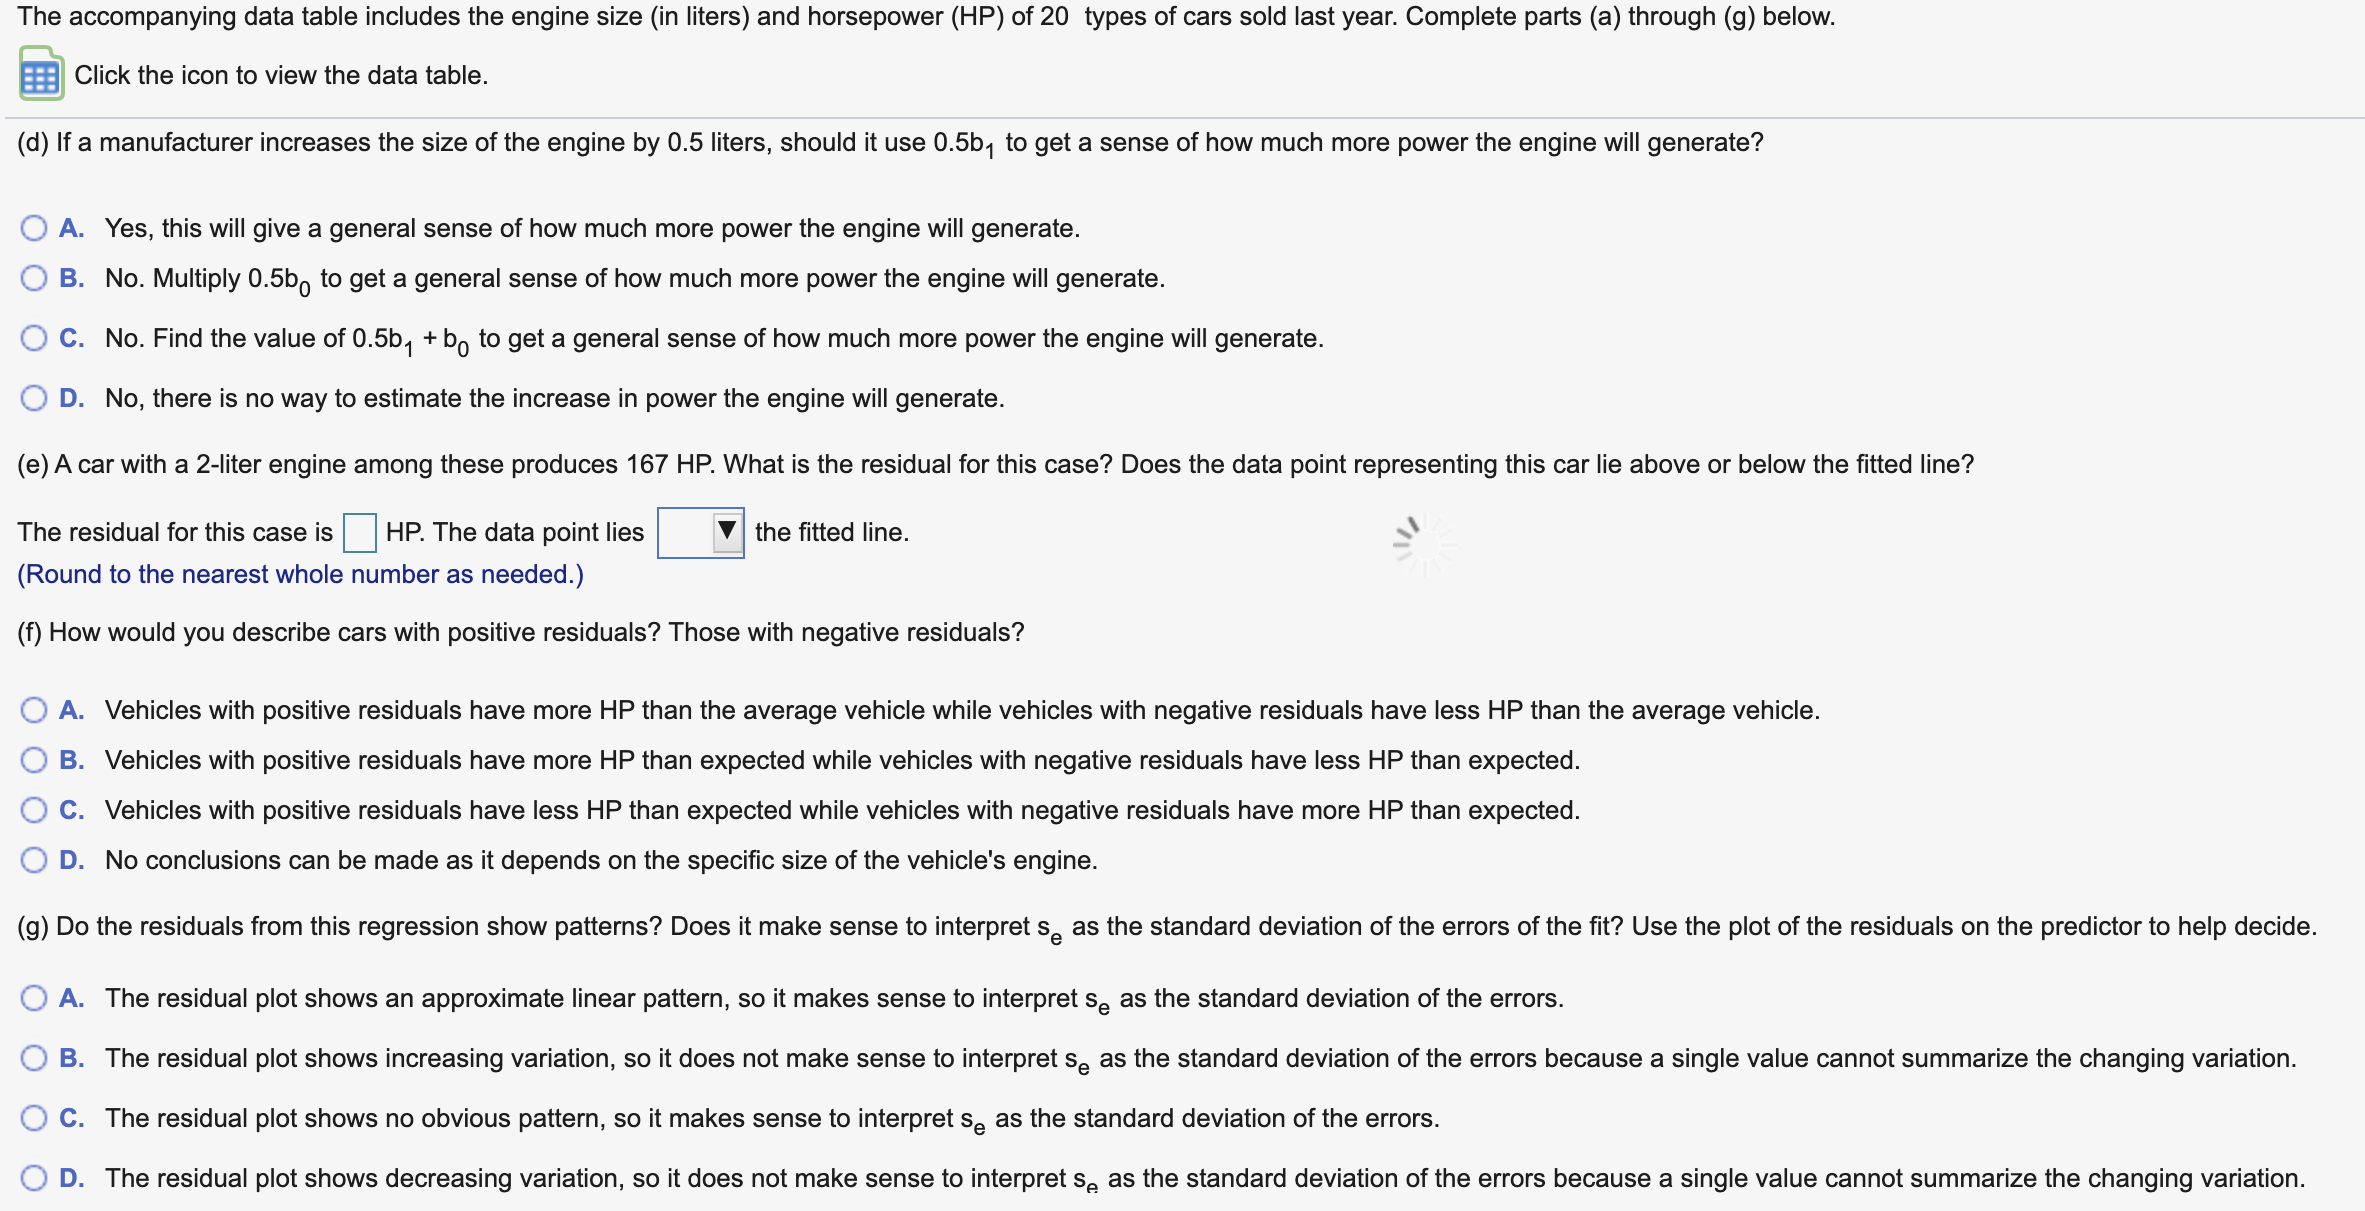
The accompanying data table includes the engine size (in liters) and horsepower (HP) of 20 types of cars sold last year. Complete parts (a) through (g) below. Click the icon to view the data table. (a) Create a scatterplot of the horsepower on the engine displacement of the car. Does the trend in average horsepower seem linear? Choose the correct graph below. O A. OB. O c. O D. 8- 450- 8- 450- Engine Size (L) Horsepower (HP) Engine Size (L) Horsepower (HP) .. . 0-+ 450 0 450 Horsepower (HP) Engine Size (L) Horsepower (HP) Engine Size (L) Does the pattern in the plot seem linear? O A. Yes, because the scatterplot shows an approximate linear pattern. O B. No, because the scatterplot shows an obvious curved line. O C. No, because the scatterplot does not show any obvious pattern. O D. Yes, because the scatterplot does not show any obvious pattern. (b) Estimate the linear equation using least squares. Interpret the fitted intercept and slope. Be sure to include their units. Note if either estimate represents a large extrapolation and is consequently not reliable. Complete the equation for the fitted line below. Estimated Horsepower (HP) = + () Engine Size (L) (Round to three decimal places as needed.)Interpret the fitted intercept. Note if the estimate represents a large extrapolation and is consequently not reliable. Select the correct choice below and fill in the answer box(es) within your choice. (Round to three decimal places as needed.) O A. The intercept is HP. For every one liter of engine size increase, the average horsepower increases by HP. O B. The intercept of HP is a large extrapolation and not directly interpretable. O C. The intercept of HP represents the average horsepower. O D. The intercept is liters. For every horsepower increase, the average engine size increases by liters. Interpret the fitted slope. Note if the estimate represents a large extrapolation and is consequently not reliable. Select the correct choice below and fill in the answer box(es) within your choice. (Round to three decimal places as needed.) O A. The slope is L/HP. For every horsepower increase, the average engine size increases by liters. O B. The slope of |HP represents the average horsepower. O C. The slope is HP/L. For every one liter of engine size increase, the average horsepower increases by HP. O D. The slope of HP is a large extrapolation and not directly interpretable. (c) Interpret the summary values r and se associated with the fitted equation. Attach units to these summary statistics as appropriate. Select the correct choice below and fill in the answer boxes within your choice. Round to one decimal place as needed.) A. The value of r means that the equation describes about % of the variation. The value of Se means that the standard deviation of the residuals is HP. O B. The value of r means that the average residual is HP. The value of se means that the equation does not describe about % of the variation. O C. The value of r means that the equation describes about % of the variation. The value of Se means that the average residual is HP.The accompanying data table includes the engine size (in liters) and horsepower (HP) of 20 types of cars sold last year. Complete parts (a) through (9) below. Click the icon to view the data table. (d) If a manufacturer increases the size of the engine by 0.5 liters, should it use 0.5b1 to get a sense of how much more power the engine will generate? O A. Yes, this will give a general sense of how much more power the engine will generate. O B. No. Multiply 0.5bo to get a general sense of how much more power the engine will generate. O C. No. Find the value of 0.5b1 + b0 to get a general sense of how much more power the engine will generate. O D. No, there is no way to estimate the increase in power the engine will generate. (e)Acar with a 2liter engine among these produces 167 HP. What is the residual for this case? Does the data point representing this car lie above or below the tted line? The residual for this case is E HP. The data point lies 1 the tted line. 3' (Round to the nearest whole number as needed.) (f) How would you describe cars with positive residuals? Those with negative residuals? O A. Vehicles with positive residuals have more HP than the average vehicle while vehicles with negative residuals have less HP than the average vehicle. 0 B. Vehicles with positive residuals have more HP than expected while vehicles with negative residuals have less HP than expected. 0 C. Vehicles with positive residuals have less HP than expected while vehicles with negative residuals have more HP than expected. 0 D. No conclusions can be made as it depends on the specic size of the vehicle's engine. (9) Do the residuals from this regression show patterns? Does it make sense to interpret se as the standard deviation of the errors of the t? Use the plot of the residuals on the predictor to help decide. 0 A. The residual plot shows an approximate linear pattern, so it makes sense to interpret Se as the standard deviation of the errors. 0 B. The residual plot shows increasing variation, so it does not make sense to interpret se as the standard deviation of the errors because a single value cannot summarize the changing variation. O C. The residual plot shows no obvious pattern, so it makes sense to interpret se as the standard deviation of the errors. 0 D. The residual plot shows decreasing variation, so it does not make sense to interpret se as the standard deviation of the errors because a single value cannot summarize the changing variation