Question
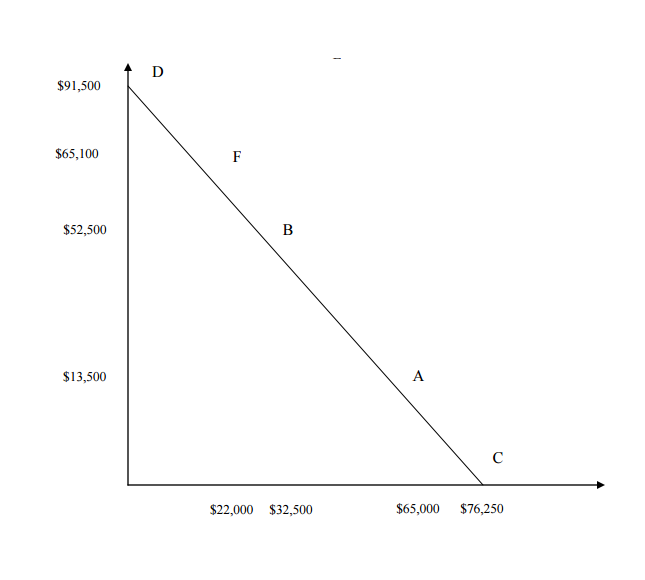
Enrique Rodrigues has $65,000 this year. He faces the investment opportunities represented by point B in the following figure. He wants to consume $22,000 this
Enrique Rodrigues has $65,000 this year. He faces the investment opportunities represented by point B in the following figure. He wants to consume $22,000 this year and $65,100 next year. This pattern of consumption is represented by point F.
(a) [1] What is the market interest rate?
(b) [2] How much must Enrique invest in financial assets and productive assets today if he follows an optimum strategy? Note: Productive assets are nonfinancial assets or real assets.
(c) [1] What is the NPV of his investment in nonfinancial assets?
(d) [1] What is the NPV of his investment in financial assets?
HINT: In the diagram that follows, sketch the investment opportunities curve. It begins at the point on the horizontal axis labelled $65,000 and is tangent to the straight line with slope (1 )r at point B.
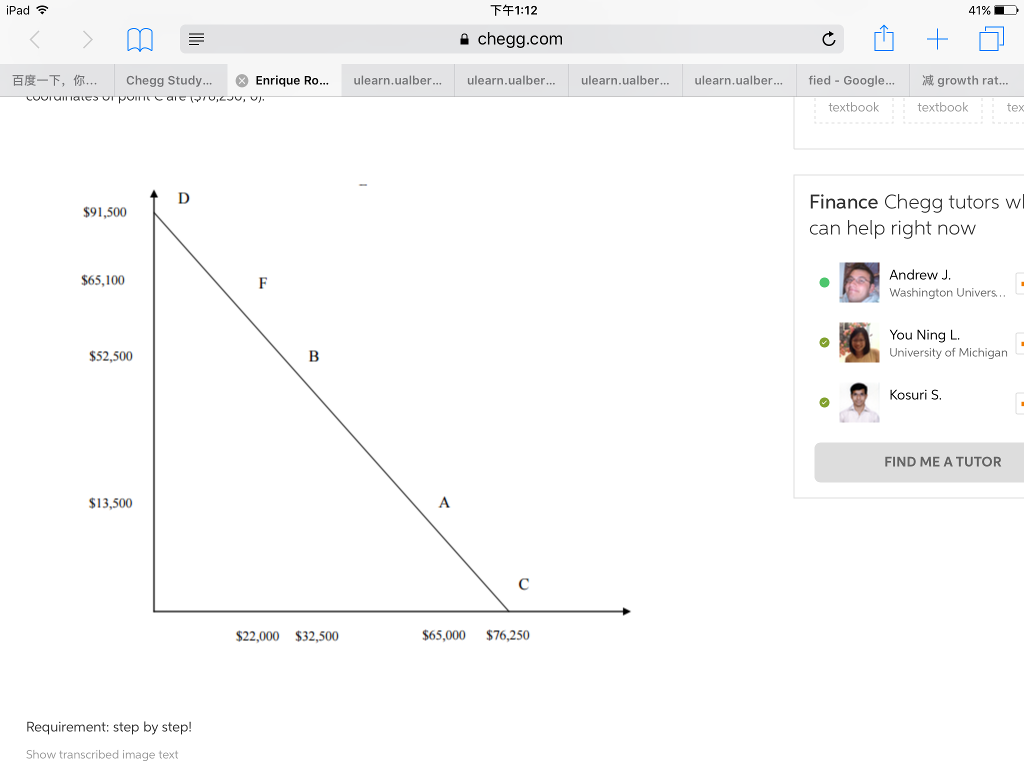
Note: The coordinates of point D are (0; $91,500). The coordinates of point F are ($22,000; $65,100). The coordinates of point B are ($32,500; $52,500). The coordinates of point A are ($65,000; $13,500). The coordinates of point C are ($76,250; 0). 
 Requirement: step by step!
Step by Step Solution
There are 3 Steps involved in it
Step: 1

Get Instant Access to Expert-Tailored Solutions
See step-by-step solutions with expert insights and AI powered tools for academic success
Step: 2

Step: 3

Ace Your Homework with AI
Get the answers you need in no time with our AI-driven, step-by-step assistance
Get Started


