Answered step by step
Verified Expert Solution
Question
1 Approved Answer
Enter a formula in cell C6 that calculates the annual percentage change in Starbucks cash position from 2017 to 2018 using the data provided on
- Enter a formula in cell C6 that calculates the annual percentage change in Starbucks’ cash position from 2017 to 2018 using the data provided on the “FinStms” worksheet (make sure to use relative cell references in this formula). Format this value as a calculated percentage with one decimal.

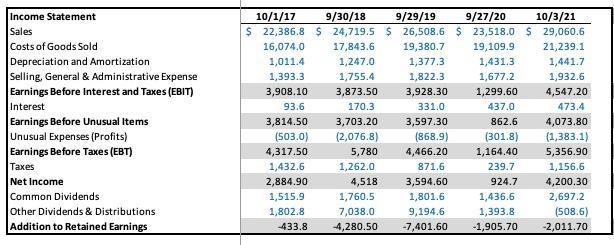
Income Statement 10/1/17 9/30/18 9/29/19 9/27/20 10/3/21 Sales $ 22,386.8 $ 24,719.5 $ 26,508.6 $ 23,518.0 $ 29,060.6 Costs of Goods Sold 16,074.0 17,843.6 19,380.7 19,109.9 21,239.1 Depreciation and Amortization Selling, General & Administrative Expense Earnings Before Interest and Taxes (EBIT) 1,011.4 1,247.0 1,377.3 1,431.3 1,441.7 1,393.3 1,755.4 1,822.3 1,677.2 1,932.6 3,908.10 3,873.50 3,928.30 1,299.60 4,547.20 Interest 93.6 170.3 331.0 437.0 473.4 Earnings Before Unusual Items Unusual Expenses (Profits) Earnings Before Taxes (EBT) es Net Income Common Dividends 3,814.50 3,703.20 3,597.30 862.6 4,073.80 (1,383.1) (503.0) 4,317.50 1,432.6 (2,076.8) (868.9) (301.8) 5,780 4,466.20 1,164.40 5,356.90 1,262.0 871.6 239.7 1,156.6 2,884.90 4,518 3,594.60 924.7 4,200.30 1,515.9 1,760.5 1,801.6 1,436.6 2,697.2 Other Dividends & Distributions 1,802.8 7,038.0 9,194.6 1,393.8 (508.6) Addition to Retained Earnings 433.8 4,280.50 -7,401.60 -1,905.70 -2,011.70
Step by Step Solution
There are 3 Steps involved in it
Step: 1

Get Instant Access to Expert-Tailored Solutions
See step-by-step solutions with expert insights and AI powered tools for academic success
Step: 2

Step: 3

Ace Your Homework with AI
Get the answers you need in no time with our AI-driven, step-by-step assistance
Get Started


