Question
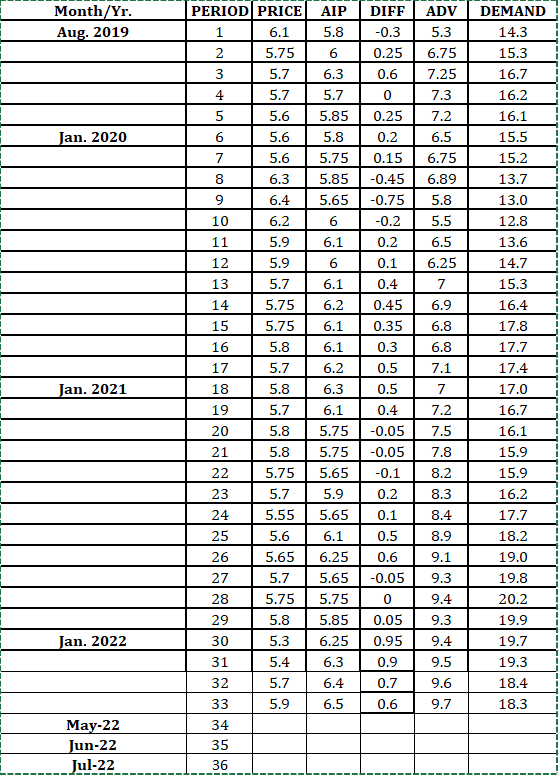
Enterprise Industries produces Fresh, a brand of liquid detergent. In order to more effectively manage its inventory, the company would like to better predict demand
Enterprise Industries produces Fresh, a brand of liquid detergent. In order to more effectively manage its inventory, the company would like to better predict demand for Fresh. To develop a prediction model, the company has gathered data concerning demand for Fresh over the last 33 sales periods. Each sales period is defined as one month. The variables are as follows:
Demand = Y = demand for a large size bottle of Fresh (in 100,000)
Price = the price of Fresh as offered by Ent. Industries
AIP = the average industry price
ADV = Ent. Industries Advertising Expenditure (in $100,000) to Promote Fresh in the sales period.
DIFF = AIP - Price = the "price difference" in the sales period
- Make time series scatter plots of all five variables (five graphs). Insert trend line, equation, and R-squared. Observe graphs and provide interpretation of results.
- Construct scatter plots of Demand vs. DIFF and Demand vs. ADV, Demand vs. AIP, and Demand vs. Price. Insert linear fitted line, equation, and R-squared. Observe graphs and provide interpretation. Note that Demand is always on the Y axis.

Step by Step Solution
There are 3 Steps involved in it
Step: 1

Get Instant Access to Expert-Tailored Solutions
See step-by-step solutions with expert insights and AI powered tools for academic success
Step: 2

Step: 3

Ace Your Homework with AI
Get the answers you need in no time with our AI-driven, step-by-step assistance
Get Started


