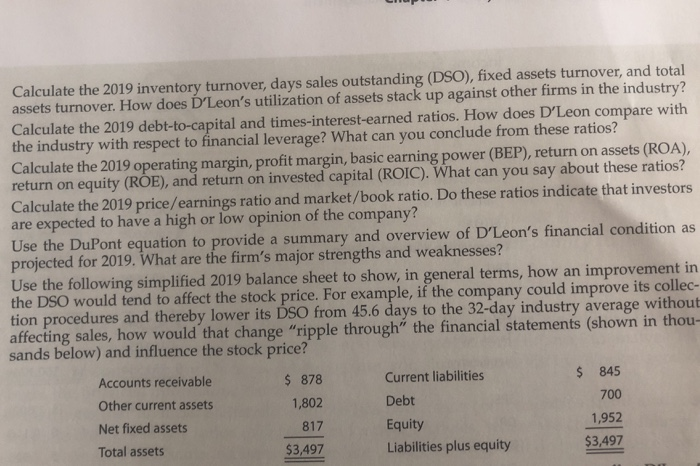
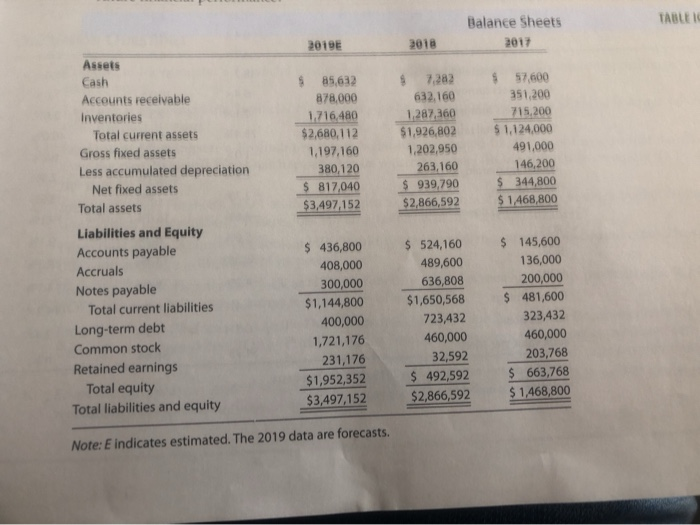
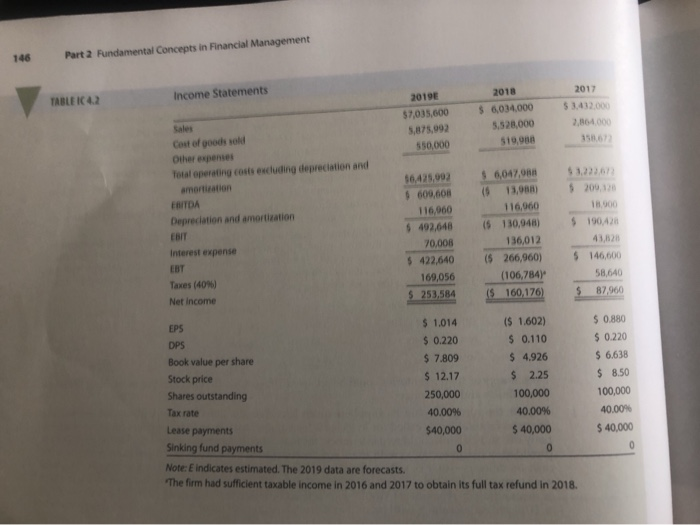
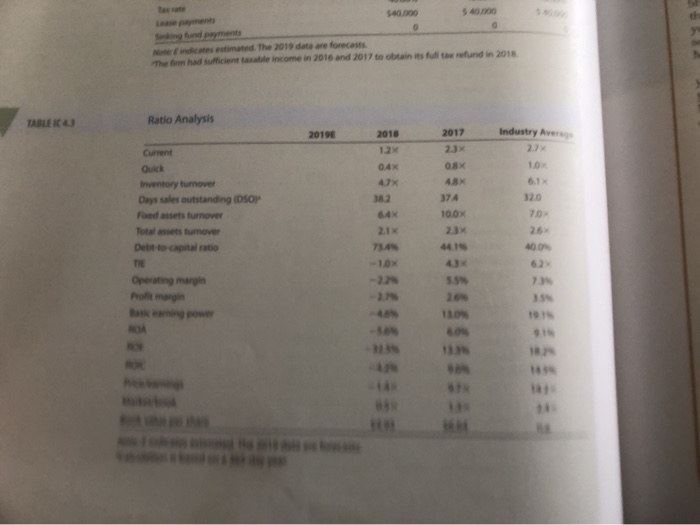
EON INC., PARTII 26 FINANCIAL STATEMENTS AND TAXES Part I of this case, presented in Chapter 3, discussed the situation of D'Leon Inc, a regional snack foods producer, after an expansion program. D'Leon had increased plant capacit and undertaken a major marketing campaign in an attempt to "go national." Thus far, sales have not been u to the forecasted level, costs have been higher than were projected, and a large loss occurred in 2018 rather than the expected profit. As a result, its managers, directors, and investors are concerned about the firm's survival. Donna Jamison was brought in as assistant to Fred Campo, D'Leon's chairman, who had the task of getting the company back into a sound financial position. D'Leon's 2017 and 2018 balance sheets and income statements, together with projections for 2019, are given in Tables IC 4.1 and IC 4.2. In addition, Table IC 4.3 gives the company's 2017 and 2018 financial ratios, together with industry average data The 2019 projected financial statement data represent Jamison's and Campo's best guess for 2019 results, assuming that some new financing is arranged to get the company "over the hump Jamison examined monthly data for 2018 (not given in the case), and she detected an improving ern during the year. Monthly sales were rising, costs were falling, and large losses in the early months had to a smal profit by December. Thus, t Also, it appears to be taking longer for the advertising program to get the message out, for the new offices to generate sales, and for the new manufacturing facilities to operate efficiently. In other wor lags between spending money and deriving benefits were longer than D'Leon's managers had anticipa For these reasons, Jamison and Campo see hope for the company-provided it can survive in the short run Jamison must prepare an analysis of where the company is now, what it must do to regain its financia health, and what actions should be taken. Your assignment is to help her answer the following questions Provide clear explanations, not yes or no answers pat- mber. Thus, the annual data look somewhat worse than final monthly data. Calculate the 2019 inventory turnover, days sales outstanding (DSO), fixed assets turnover, and total assets turnover. How does D'Leon's utilization of assets stack up against other firms in the industry? Calculate the 2019 debt-to-capital and times-interest-earned ratios. How does D'Leon compare with the industry with respect to financial leverage? What can you conclude from these ratios? Calculate the 2019 operating margin, profit margin, basic earning power (BEP), return on assets (ROA), return on equity (ROE), and return on invested capital (ROIC). What can you say about these ratios? Calculate the 2019 price/earnings ratio and market/book ratio. Do these ratios indicate that investors are expected to have a high or low opinion of the company? Use the DuPont equation to provide a summary and overview of D'Leon's financial condition as projected for 2019. What are the firm's major strengths and weaknesses? Use the following simplified 2019 balance sheet to show, in general terms, how an improv the DSO would tend to affect the stock price. For example, if the company could improve its collec tion procedures and thereby lower its DSO from 45.6 days to the 32-day industry average without affecting sales, how would that change "ripple through" the financial statements (shown in thou sands below) and influence the stock price? ement in Accounts receivable 878 $ 845 Current liabilities Other current assets 1,802 700 Debt Net fixed assets 1,952 817 Equity Total assets $3,497 $3,497 Liabilities plus equity Balance Sheets TABLE 2019E 2018 2017 Assets Cash 85,632 7,282 57,600 878,000 1716.4801.287 360 $2.680,112 Accounts receivable 351,200 632,160 Inventories 715,200 Total current assets 1,926,802 1,124,000 491,000 Gross fixed assets 1,197,160 1,202,950 Less accumulated depreciation Net fixed assets 380,120 263,160 146,200 939790 344800 $2,866,592 $ 817040 $ 344,800 Total assets $3,497152 $ 1,468,800 Liabilities and Equity Accounts payable 436,800 524,160 145,600 489,600 Accruals 408,000 136,000 Notes payable Total current liabilities 636,808 300,000 200,000 $1,144,800 $ 481,600 $1,650,568 400,000 723,432 323,432 460,000 Long-term debt 460,000 1,721,176 Common stock 231,17632,592 $ 492,592 203,768 Retained earnings Total equity 663,768 $1,952,352 $ 1,468,800 $2,866,592 $3,497,152 Total liabilities and equity Note: E indicates estimated. The 2019 data are forecasts Part 2 Fundamental Concepts in Financial Management 146 Income Statements TABLE IC 4.2 2018 2017 2019E 6034,000 3,432.000 5,528,000 7,035,600 Sales 5,875,992 Cest of goods sold 519,988 550,000 Other expenses Total operating costs excluding depreciation and 25,992 6,047,988 $3.2236 amotieation 609,608( 13,0988) 209,32 116,960 EBITDA 116,060 18.900 Depreciation and amortization 190,42 492648( 130,948) 70,008 EBIT 136,012 interest expense 43,828 422.640 260,960 146.00 EBT Taxes (40%) 169,056 (106,784) 58,640 Net income 253,584 160,176 87,960 EPS $ 1.014 0.220 $7.809 ($ 1.602) 0.880 DPS 0.220 $ 6.638 $ 0.110 Book value per share 4.926 Stock price $12.17 $ 2.25 8.50 Shares outstanding 250,000 100,000 100,000 Tax rate 40.00% 40.00% 40.00% Lease payments $40,000 $ 40,000 40,000 Sinking fund payments Note E indicates estimated. The 2019 data are forecasts. The firm had sufficient taxable income in 2016 and 2017 to obtain its full tax refund in 2018 5 40 300 $40.000 Note Einicates estimated. The 2019 data are forecasts The fom had sufficient taxable income in 2016 and 2017 to obtain its full tax refund in 2018 Ratio Analysis ABLE IC 4 20198 201 2017 Industry Aver 2.7% 2.3x 1.2x 10x 08x 04x 6.1x 48X Inventory turmover Days sales outstanding (DSOP 320 374 70x 100x 64x Fxed assets turnove 23x 26x Total assets tunover 2.1x 73A% 441% 400% 10X 62% 43x Operating margin Profit margin 73% 27% 26% Bas earning por 1s ,325% ,33% 1499 EON INC., PARTII 26 FINANCIAL STATEMENTS AND TAXES Part I of this case, presented in Chapter 3, discussed the situation of D'Leon Inc, a regional snack foods producer, after an expansion program. D'Leon had increased plant capacit and undertaken a major marketing campaign in an attempt to "go national." Thus far, sales have not been u to the forecasted level, costs have been higher than were projected, and a large loss occurred in 2018 rather than the expected profit. As a result, its managers, directors, and investors are concerned about the firm's survival. Donna Jamison was brought in as assistant to Fred Campo, D'Leon's chairman, who had the task of getting the company back into a sound financial position. D'Leon's 2017 and 2018 balance sheets and income statements, together with projections for 2019, are given in Tables IC 4.1 and IC 4.2. In addition, Table IC 4.3 gives the company's 2017 and 2018 financial ratios, together with industry average data The 2019 projected financial statement data represent Jamison's and Campo's best guess for 2019 results, assuming that some new financing is arranged to get the company "over the hump Jamison examined monthly data for 2018 (not given in the case), and she detected an improving ern during the year. Monthly sales were rising, costs were falling, and large losses in the early months had to a smal profit by December. Thus, t Also, it appears to be taking longer for the advertising program to get the message out, for the new offices to generate sales, and for the new manufacturing facilities to operate efficiently. In other wor lags between spending money and deriving benefits were longer than D'Leon's managers had anticipa For these reasons, Jamison and Campo see hope for the company-provided it can survive in the short run Jamison must prepare an analysis of where the company is now, what it must do to regain its financia health, and what actions should be taken. Your assignment is to help her answer the following questions Provide clear explanations, not yes or no answers pat- mber. Thus, the annual data look somewhat worse than final monthly data. Calculate the 2019 inventory turnover, days sales outstanding (DSO), fixed assets turnover, and total assets turnover. How does D'Leon's utilization of assets stack up against other firms in the industry? Calculate the 2019 debt-to-capital and times-interest-earned ratios. How does D'Leon compare with the industry with respect to financial leverage? What can you conclude from these ratios? Calculate the 2019 operating margin, profit margin, basic earning power (BEP), return on assets (ROA), return on equity (ROE), and return on invested capital (ROIC). What can you say about these ratios? Calculate the 2019 price/earnings ratio and market/book ratio. Do these ratios indicate that investors are expected to have a high or low opinion of the company? Use the DuPont equation to provide a summary and overview of D'Leon's financial condition as projected for 2019. What are the firm's major strengths and weaknesses? Use the following simplified 2019 balance sheet to show, in general terms, how an improv the DSO would tend to affect the stock price. For example, if the company could improve its collec tion procedures and thereby lower its DSO from 45.6 days to the 32-day industry average without affecting sales, how would that change "ripple through" the financial statements (shown in thou sands below) and influence the stock price? ement in Accounts receivable 878 $ 845 Current liabilities Other current assets 1,802 700 Debt Net fixed assets 1,952 817 Equity Total assets $3,497 $3,497 Liabilities plus equity Balance Sheets TABLE 2019E 2018 2017 Assets Cash 85,632 7,282 57,600 878,000 1716.4801.287 360 $2.680,112 Accounts receivable 351,200 632,160 Inventories 715,200 Total current assets 1,926,802 1,124,000 491,000 Gross fixed assets 1,197,160 1,202,950 Less accumulated depreciation Net fixed assets 380,120 263,160 146,200 939790 344800 $2,866,592 $ 817040 $ 344,800 Total assets $3,497152 $ 1,468,800 Liabilities and Equity Accounts payable 436,800 524,160 145,600 489,600 Accruals 408,000 136,000 Notes payable Total current liabilities 636,808 300,000 200,000 $1,144,800 $ 481,600 $1,650,568 400,000 723,432 323,432 460,000 Long-term debt 460,000 1,721,176 Common stock 231,17632,592 $ 492,592 203,768 Retained earnings Total equity 663,768 $1,952,352 $ 1,468,800 $2,866,592 $3,497,152 Total liabilities and equity Note: E indicates estimated. The 2019 data are forecasts Part 2 Fundamental Concepts in Financial Management 146 Income Statements TABLE IC 4.2 2018 2017 2019E 6034,000 3,432.000 5,528,000 7,035,600 Sales 5,875,992 Cest of goods sold 519,988 550,000 Other expenses Total operating costs excluding depreciation and 25,992 6,047,988 $3.2236 amotieation 609,608( 13,0988) 209,32 116,960 EBITDA 116,060 18.900 Depreciation and amortization 190,42 492648( 130,948) 70,008 EBIT 136,012 interest expense 43,828 422.640 260,960 146.00 EBT Taxes (40%) 169,056 (106,784) 58,640 Net income 253,584 160,176 87,960 EPS $ 1.014 0.220 $7.809 ($ 1.602) 0.880 DPS 0.220 $ 6.638 $ 0.110 Book value per share 4.926 Stock price $12.17 $ 2.25 8.50 Shares outstanding 250,000 100,000 100,000 Tax rate 40.00% 40.00% 40.00% Lease payments $40,000 $ 40,000 40,000 Sinking fund payments Note E indicates estimated. The 2019 data are forecasts. The firm had sufficient taxable income in 2016 and 2017 to obtain its full tax refund in 2018 5 40 300 $40.000 Note Einicates estimated. The 2019 data are forecasts The fom had sufficient taxable income in 2016 and 2017 to obtain its full tax refund in 2018 Ratio Analysis ABLE IC 4 20198 201 2017 Industry Aver 2.7% 2.3x 1.2x 10x 08x 04x 6.1x 48X Inventory turmover Days sales outstanding (DSOP 320 374 70x 100x 64x Fxed assets turnove 23x 26x Total assets tunover 2.1x 73A% 441% 400% 10X 62% 43x Operating margin Profit margin 73% 27% 26% Bas earning por 1s ,325% ,33% 1499