

Question
Espa ol The data points show the distance y in meters required to stop a train traveling at a speed x in kilometers p Each
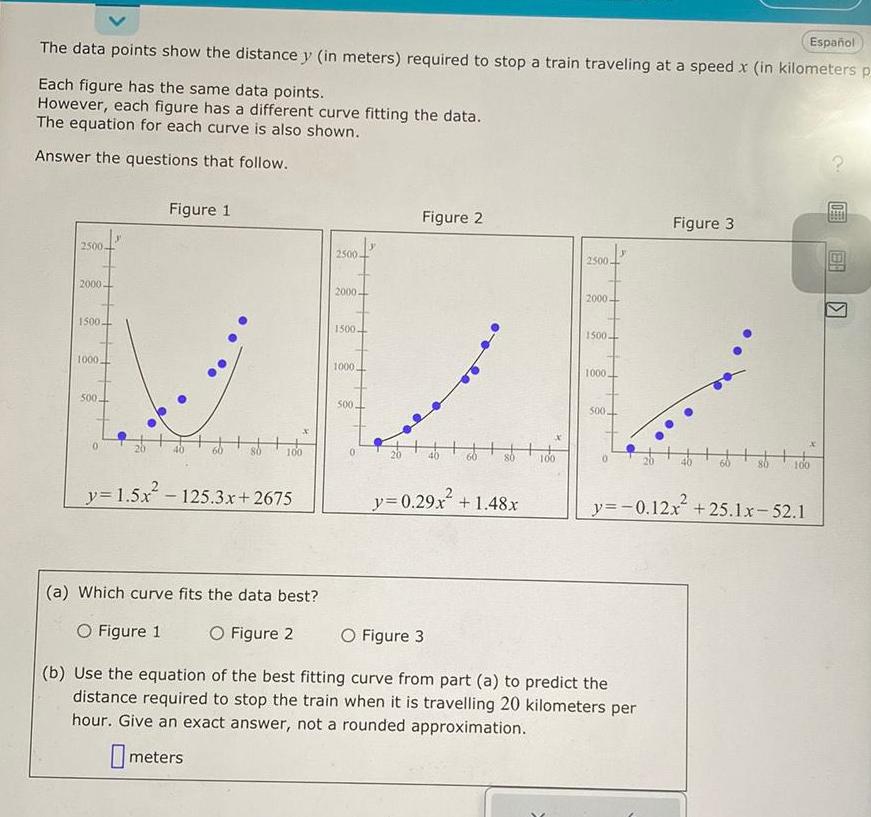

Espa ol The data points show the distance y in meters required to stop a train traveling at a speed x in kilometers p Each figure has the same data points However each figure has a different curve fitting the data The equation for each curve is also shown Answer the questions that follow 2500 2000 1500 1000 500 y 1 5x Figure 1 100 125 3x 2675 a Which curve fits the data best O Figure 1 O Figure 2 2500 2000 1500 1000 500 Figure 2 y 0 29x 1 48x 100 2500 2000 1500 P 1000 500 Figure 3 y 0 12x O Figure 3 b Use the equation of the best fitting curve from part a to predict the distance required to stop the train when it is travelling 20 kilometers per hour Give an exact answer not a rounded approximation meters 100 25 1x 52 1 0 K
Step by Step Solution
There are 3 Steps involved in it
Step: 1

Get Instant Access to Expert-Tailored Solutions
See step-by-step solutions with expert insights and AI powered tools for academic success
Step: 2

Step: 3
Ace Your Homework with AI
Get the answers you need in no time with our AI-driven, step-by-step assistance
Get Started
Calculus Single Variable
Authors: Carl V Lutzer, H T Goodwill
1st Edition
1118137698, 9781118137697