Answered step by step
Verified Expert Solution
Question
1 Approved Answer
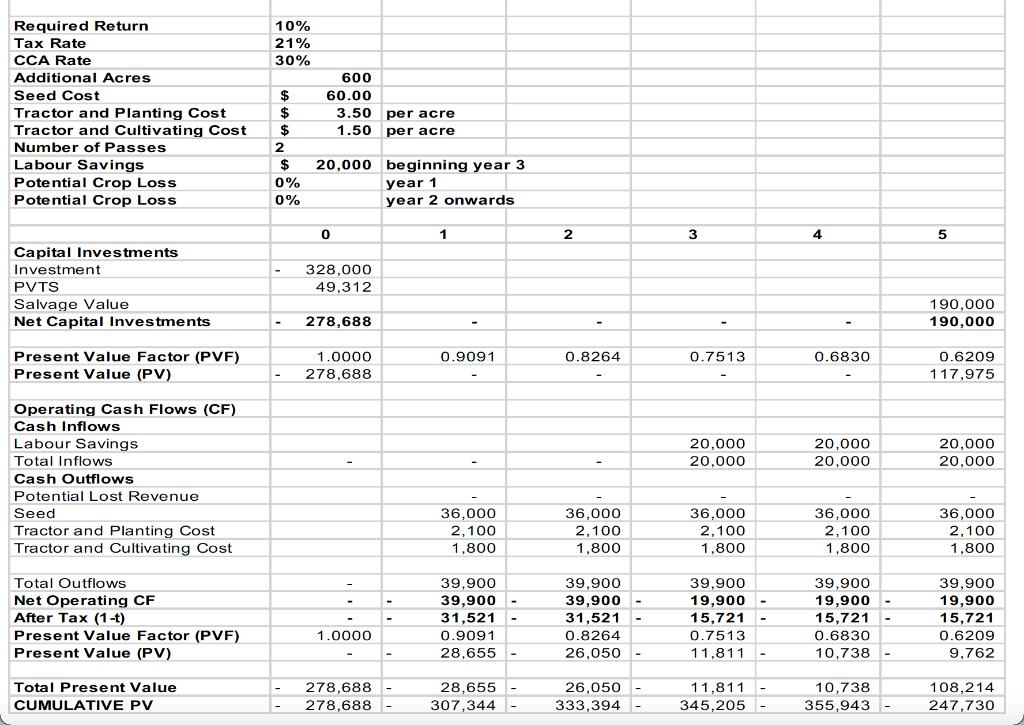
Estimate net present value; Machinery investment Required Return 10% Tax Rate 21% CCA Rate 30% Additional Acres 600 Seed Cost $ 60.00 Tractor and Planting
Estimate net present value;
| Machinery investment | ||||||
| Required Return | 10% | |||||
| Tax Rate | 21% | |||||
| CCA Rate | 30% | |||||
| Additional Acres | 600 | |||||
| Seed Cost | $ 60.00 | |||||
| Tractor and Planting Cost | $ 3.50 | per acre | ||||
| Tractor and Cultivating Cost | $ 1.50 | per acre | ||||
| Number of Passes | 2 | |||||
| Labour Savings | $ 20,000 | beginning year 3 | ||||
| Potential Crop Loss | 0% | year 1 | ||||
| Potential Crop Loss | 0% | year 2 onwards | ||||
| 0 | 1 | 2 | 3 | 4 | 5 | |
| Capital Investments | ||||||
| Investment | - 328,000 | |||||
| PVTS | 49,312 | |||||
| Salvage Value | 190,000 | |||||
| Net Capital Investments | - 278,688 | - | - | - | - | 190,000 |
| Present Value Factor (PVF) | 1.0000 | 0.9091 | 0.8264 | 0.7513 | 0.6830 | 0.6209 |
| Present Value (PV) | - 278,688 | - | - | - | - | 117,975 |
| Operating Cash Flows (CF) | ||||||
| Cash Inflows | ||||||
| Labour Savings | 20,000 | 20,000 | 20,000 | |||
| Total Inflows | - | - | - | 20,000 | 20,000 | 20,000 |
| Cash Outflows | ||||||
| Potential Lost Revenue | - | - | - | - | - | |
| Seed | 36,000 | 36,000 | 36,000 | 36,000 | 36,000 | |
| Tractor and Planting Cost | 2,100 | 2,100 | 2,100 | 2,100 | 2,100 | |
| Tractor and Cultivating Cost | 1,800 | 1,800 | 1,800 | 1,800 | 1,800 | |
| Total Outflows | - | 39,900 | 39,900 | 39,900 | 39,900 | 39,900 |
| Net Operating CF | - | - 39,900 | - 39,900 | - 19,900 | - 19,900 | - 19,900 |
| After-Tax (1-t) | - | - 31,521 | - 31,521 | - 15,721 | - 15,721 | - 15,721 |
| Present Value Factor (PVF) | 1.0000 | 0.9091 | 0.8264 | 0.7513 | 0.6830 | 0.6209 |
| Present Value (PV) | - | - 28,655 | - 26,050 | - 11,811 | - 10,738 | - 9,762 |
| Total Present Value | - 278,688 | - 28,655 | - 26,050 | - 11,811 | - 10,738 | 108,214 |
| CUMULATIVE PV | - 278,688 | - 307,344 | - 333,394 | - 345,205 | - 355,943 | - 247,730 |

Note: The investor estimated that the additional 600 acres of this crop would generate an additional $ 1 million annually, starting from the second year. Also, the investor decided to exclude values such as soil fertility ($ 125 per acre) and operating costs ($ 230 per acre) from their analysis. Therefore, these are not included in the calculation.
Please give advise me on what else needs to be calculated. I will ask this question again with additional necessary steps needing to be done. Thanks!
10% 21% 30% Required Return Tax Rate CCA Rate Additional Acres Seed Cost Tractor and Planting Cost Tractor and Cultivating Cost Number of Passes Labour Savings Potential Crop Loss Potential Crop Loss 600 60.00 3.50 1.50 per acre per acre $ $ $ 2 $ 0% 0% 20,000 beginning year 3 year 1 year 2 onwards 0 1 2 3 4 5 Capital Investments Investment PVTS Salvage Value Net Capital Investments 328,000 49,312 190,000 190,000 278,688 0.9091 0.8264 0.7513 0.6830 Present Value Factor (PVF) Present Value (PV) 1.0000 278,688 0.6209 117,975 20,000 20,000 20,000 20,000 20,000 20,000 Operating Cash Flows (CF) Cash Inflows Labour Savings Total Inflows Cash Outflows Potential Lost Revenue Seed Tractor and Planting Cost Tractor and Cultivating Cost 36,000 2,100 1,800 36,000 2,100 1,800 36,000 2,100 1,800 36,000 2,100 1,800 36,000 2,100 1,800 Total Outflows Net Operating CF After Tax (1-t) Present Value Factor (PVF) Present Value (PV) 39,900 39,900 31,521 0.9091 28,655 39.900 39,900 31,521 0.8264 26,050 39,900 19,900 15,721 0.7513 11.811 39,900 19,900 15,721 0.6830 10.738 39,900 19,900 15,721 0.6209 9,762 1.0000 Total Present Value CUMULATIVE PV 278,688 278,688 28,655 307,344 26,050 333,394 11,811 345,205 10,738 355,943 108,214 247,730 10% 21% 30% Required Return Tax Rate CCA Rate Additional Acres Seed Cost Tractor and Planting Cost Tractor and Cultivating Cost Number of Passes Labour Savings Potential Crop Loss Potential Crop Loss 600 60.00 3.50 1.50 per acre per acre $ $ $ 2 $ 0% 0% 20,000 beginning year 3 year 1 year 2 onwards 0 1 2 3 4 5 Capital Investments Investment PVTS Salvage Value Net Capital Investments 328,000 49,312 190,000 190,000 278,688 0.9091 0.8264 0.7513 0.6830 Present Value Factor (PVF) Present Value (PV) 1.0000 278,688 0.6209 117,975 20,000 20,000 20,000 20,000 20,000 20,000 Operating Cash Flows (CF) Cash Inflows Labour Savings Total Inflows Cash Outflows Potential Lost Revenue Seed Tractor and Planting Cost Tractor and Cultivating Cost 36,000 2,100 1,800 36,000 2,100 1,800 36,000 2,100 1,800 36,000 2,100 1,800 36,000 2,100 1,800 Total Outflows Net Operating CF After Tax (1-t) Present Value Factor (PVF) Present Value (PV) 39,900 39,900 31,521 0.9091 28,655 39.900 39,900 31,521 0.8264 26,050 39,900 19,900 15,721 0.7513 11.811 39,900 19,900 15,721 0.6830 10.738 39,900 19,900 15,721 0.6209 9,762 1.0000 Total Present Value CUMULATIVE PV 278,688 278,688 28,655 307,344 26,050 333,394 11,811 345,205 10,738 355,943 108,214 247,730Step by Step Solution
There are 3 Steps involved in it
Step: 1

Get Instant Access to Expert-Tailored Solutions
See step-by-step solutions with expert insights and AI powered tools for academic success
Step: 2

Step: 3

Ace Your Homework with AI
Get the answers you need in no time with our AI-driven, step-by-step assistance
Get Started


